Surveys are everywhere. We are asked to comment almost every day, whether in the form of short pop-ups on websites or extensive feedback forms at the end of a purchase. Although surveys will assist organizations to make products and services better, it may also overwhelm the individuals being surveyed. Survey fatigue enters into the picture here.
Survey fatigue occurs when individuals become bored or annoyed with surveys due to excessive length, frequency or ineffective design. The result? Reduced engagement, poor quality of data, and insights that do not represent reality.
This guide will show you precisely what survey fatigue is, why it is important to everybody, and the practical methods of preventing it. We will also discuss the most prevalent pitfalls, provide real-life examples, and provide you with the checklist that you can use anytime to make your surveys interesting and useful.
What is Survey Fatigue?

When individuals become demotivated to fill out a survey due to the perception that it is too long, repetitive, or irrelevant, that is called survey fatigue, which results in fewer answers and worse data.
To take an example, suppose you get three customer feedback surveys in a week in the same online store. With the third one, you will be less likely to open it, not to mention finishing it. Such a decline in willingness to answer is survey fatigue in action.
It does not occur only with long forms. A survey, even a brief one, can cause fatigue when it is not timely, is irrelevant, or is overloaded. This is why the first step to avoiding survey fatigue is to understand it, and how it operates.
Why Survey Fatigue Matters for Everyone
Survey fatigue is not merely a nuisance but it has actual impacts on the respondents and the organizations. The lack of engagement of people in surveys leads to a decline in the quality of data gathered, and this may impact the decision-making process, product enhancements, and customer or employee satisfaction.
Even a minor reduction in the participation will result in biased findings, reduced statistical validity, and unrepresentative insights. To illustrate, the survey that is done by those who complete it might not represent the rest of the population, and this distorts your information.
Consequences of survey fatigue include:
- Biased responses: Sources of biased responses are only highly motivated or dissatisfied respondents who fill out surveys.
- Less response rates (low N): Smaller samples decrease reliability.
- Straight-lining: The participants will respond with the same answer over and over again to complete the task quicker.
As per a study that was conducted in ScienceDirect, repeat surveys may decrease the response rate by as much as 2030, which underscores the importance of proper survey design and the management of survey cadence.
Types of Survey Fatigue
Survey fatigue may happen on various levels of the survey. The knowledge of the timing will assist you in avoiding it before it can impact your data. It can be divided into three major phases, namely, pre-survey, mid-survey, and post-survey fatigue.
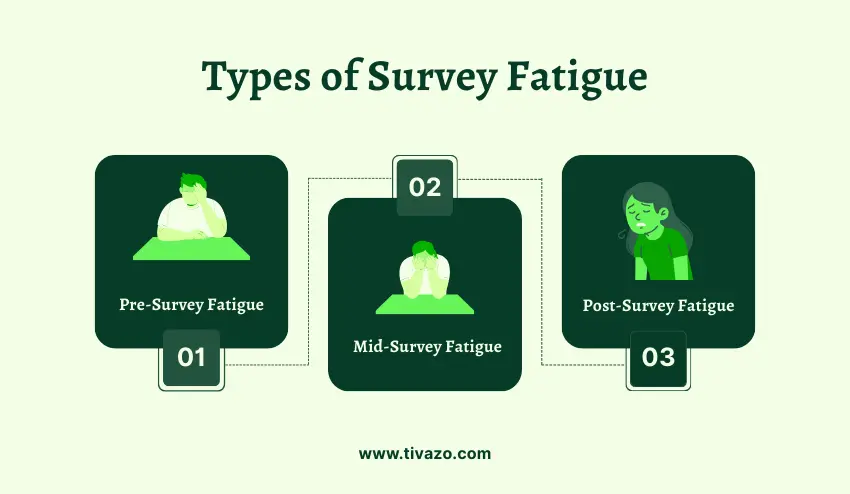
1. Pre-Survey Fatigue — Causes
Pre-survey fatigue occurs before a survey has even begun for a respondent. Common causes include:
- Over-surveying: The tendency to get several surveys within a relatively short period of time.
- Poor recruitment: Sending surveys to the wrong audience or asking the wrong people who do not have the relevant experience.
- Lack of clarity: When the respondents do not know the reason why they are being requested to take part, they might turn a blind eye to the survey.
Scenario: A customer gets weekly feedback requests on their products but they do not see how their feedback is utilized. At the third survey, they make a decision not to take part.
2. Mid-Survey Fatigue — Causes
Mid-survey fatigue arises in the process of the respondent filling in the survey. Contributing factors include:
- Long surveys: Long surveys reduce the level of drop-offs.
- Bad UX: Baffling designs, sluggish web forms, or vague directions.
- Two-part questions: It can be annoying to the respondent to ask two things in one question.
Example: In a survey with 20 questions, a respondent can begin to skip or just make random selections half way through to complete the survey in a short time.
3. Post-Survey Fatigue — Causes
Post-survey fatigue occurs after a survey is done, and it usually affects the future willingness to participate. Causes include:
- None of the feedback loop: The respondents do not receive any results or information on how their input was utilized.
- None of the visible effects: Surveys are a waste of time when there are no changes.
Scenario: Workers fill in engagement surveys once a year and do not feel that anything is done about it. The following year, the participation reduces considerably.
How Survey Fatigue Affects Data (Data-Quality Signals)
Survey fatigue is not only annoying to the respondents; it actually decreases the quality, accuracy and usefulness of the survey data. In cases where the subjects are tired, they can bypass questions, give sloppy answers, or give up on the survey. This may give rise to inaccurate insights and this subsequently influences decision making, product enhancements and customer or employee engagement strategies.
Why Monitoring Data-Quality Signals Matters
A minor dose of fatigue will skew the results. Indicatively, when only the most motivated respondents fill out a survey, your data could be biased to represent some opinions at the expense of the rest. On the same note, hurried answers may create noise and it will be difficult to pick trends or make meaningful conclusions.
Key Metrics to Watch
- Completion Rate
- The rate at which the respondents complete the survey.
- Reduced completion rate is an indicator of increased fatigue or loss of interest.
- Scenario: A web-based retailer observes that completion reduces to 60 percent in one month after increasing the number of surveys by twice.
- Breakoff Rate
- The survey point at which the respondents give up.
- Breakoff rates are usually high when the survey is long, has confusing questions, or has a bad UX.
- Example: In a survey of 20 questions, the majority of the respondents ceased to answer after question 12, which may indicate fatigue in the middle of the survey.
- Straight-Lining
- The respondents chose the same answer without reading the questions.
- Frequently comes in lengthy or repeated surveys.
- Example: In a Likert-scale satisfaction survey, 15 percent of participants would indicate 5 -Strongly Agree to all questions, which indicates disengagement.
- Completion Time
- Very quick completions can be a sign of rushing by the respondents.
- Compare actual time taken and estimated time to identify the outliers.
- Open-Ended Response Quality
- Here are some signs of fatigue when answering text questions: brief, incomplete, or absurd responses.
- When surveys become repetitive, respondents could pay less attention in giving useful feedback.
Additional Tips for Maintaining Data Quality
- Measure time series: Look for trends, not spikes.
- Segment by type of respondent: Identify fatigue patterns for groups.
- Pilot surveys: Run limited test in advance to discover any signs of fatigue before full deployment.
- Using analytics to iterate: Improve design, length and cadence.
If an organization pays close attention to these indicators, the risk of survey fatigue jeopardizing data quality can be avoided, in that the feedback provided will be trustworthy, actionable, and representable of the target audience.
7 Practical Strategies to Prevent & Reduce Survey Fatigue
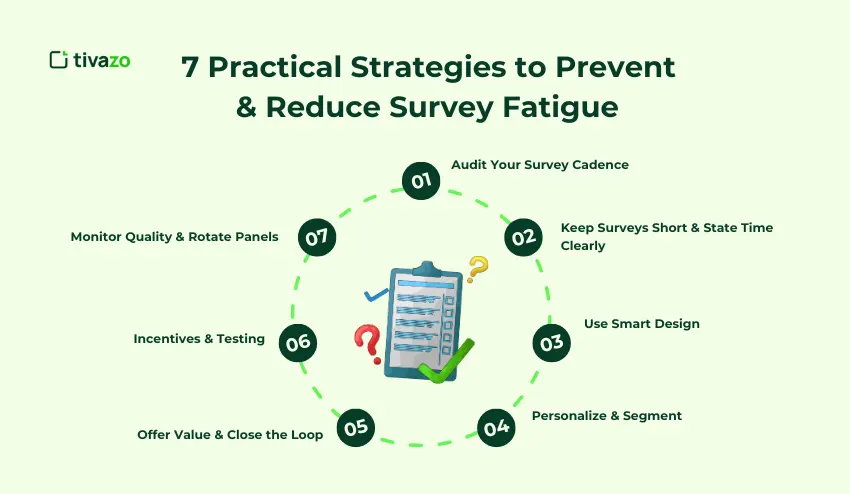
1. Audit Your Survey Cadence
Most organizations survey their audience too much, not realizing that they are making them tired. The frequency of sending surveys should be audited so that the respondents are not overworked.
Begin by enumerating all the surveys mailed within the past 6-12 months. Determine redundant subjects, follow-ups that are not necessary, and the surveys that are low-priority. Combine or do away with redundant requests.
Example: A SaaS firm cut its monthly customer survey rates to two (instead of four) and its completion rates increased to 62% to 78% in 3 months.
2. Keep Surveys Short & State Time Clearly
The greatest cause of mid-survey fatigue is long surveys. Strive to make brief questionnaires and have an estimated time at the beginning.
Max questions/time channel recommended:
- Email: 8–10 questions / 5 min
- In-app: 5 questions / 2–3 min
- SMS: 3 questions / 1–2 min
Brief surveys are an indication of respect to the time of the respondents, which enhances the response rate and quality.
Example: A brand in e-commerce reduced its feedback survey by 15 to 7 questions and included an approximate time of completion, which decreased breakoff (30% to 12).
3. Use Smart Design
UX matters. Such tools as progress bars, single question pages, and skip logic make surveys interesting. Do not have clutters and confusing layouts.
Example: A B2B company used conditional logic to conceal irrelevant questions, reducing the length of the survey by 40 percent and increasing the response rate by 25 percent.
4. Personalize & Segment
Customize surveys to every group to minimize irrelevant questions. Personalization leads to a higher level of engagement and minimizes the chances of pre-survey fatigue.
Example: Separating between new people and long-term users enabled a company to pose specific questions, which increased the response rates by 55% to 80%.
5. Offer Value & Close the Loop
The respondents will be more likely to fill out the surveys as they will see real results. Post feedback, demonstrate progress, or give useful suggestions depending on the survey outcomes. Survey fatigue occurs when individuals become bored or annoyed with surveys due to excessive length, frequency, or ineffective design. To further improve survey participation and key survey metrics, it’s essential to shorten questionnaires and optimize question relevance, as these practices significantly aid in boosting response rate and reducing respondent fatigue
Example: A customer satisfaction survey was done, and the respondents were then given a summary of what was being done. The response rate to the subsequent survey was up by 15%.
6. Incentives & Testing
Participation is encouraged by small rewards or recognition. A/B test email subject lines, timing of survey, or pilot versions to increase engagement.
Scenario: An organization experimented with two email subject lines in a feedback survey. The one with the highlighted 5-minute quick survey was viewed as open 18 times more and completed 12 times more.
7. Monitor Quality & Rotate Panels
Identify straight-lining, rushed responses, or poor engagement using quality flags. Move the survey panels so that you do not survey the same group of people too many times.
Example: A research firm that rotated the panels every month ensured that the responses were of high quality and that fatigue did not occur, so straight-lining was less than 5%.
In case you agree with this part, the next one will be the Realistic Micro Case Study, which indicates the reduction of survey fatigue with numbers and metrics before/after.
Realistic Micro Case Study
In order to observe these strategies in action, we will consider a real-life situation of reducing survey fatigue.
Problem: A brand of e-commerce was experiencing a low rate of survey completion. Their post-purchase feedback survey consisted of 20 questions and was mailed on weekly basis. The completion rates had dropped to 62 and the break off rates were 30.
Steps Taken:
- Reduced the survey to 10 questions and included estimated time of completion (3-5 minutes).
- Added skip logic to eliminate unnecessary questions with some customer groups.
- Divided customers into new and returning buyers to make questions different.
- Gave feedback and shared insights and improvements.
Outcomes (post 3 months):
- The completion rate increased from 62 to 85.
- The breakoff rate decreased from 30% → 12%.
- The straight-lining dropped to 10% – 4%.
This incident illustrates that survey design, cadence management, and personalization can dramatically reduce survey fatigue and improve data quality.
Common Mistakes & How to Avoid Them
Even well-meaning surveys may unwillingly result in survey fatigue. Knowledge of common pitfalls and how to avoid them will keep your surveys effective, interesting and provide quality data. The following is a closer examination of the seven pitfalls:
1. Sending Surveys Too Often
Error: Conducting more than one survey to the respondents within a relatively short period causes pre-survey fatigue. The participants get overwhelmed and disregard or even fail to take surveys altogether.
How to Avoid:
- Audit your survey schedule to detect overlapping or redundant surveys.
- Combine several surveys on the same subject into one survey.
- Conduct schedule surveys (e.g. monthly or quarterly) rather than weekly.
Example: A SaaS company cut down monthly customer surveys to two. Three months later the completion rates increased by 16 percent.
2. Ignoring Analytics
Error: Failure to monitor such metrics as the completion rate, breakoff rate, straight-lining, and completion time may conceal the initial symptoms of fatigue.
How to Avoid:
- Install dashboards to track the important survey performance indicators.
- Periodically check trends as opposed to spikes.
- Corrective action should be taken in case of thresholds being crossed (e.g. completion rate <70%).
Example: In a 20-question survey, a breakoff spike was observed at question 10 during the monitoring. The completion rates went up by 20 percent with reordering questions and skip logic.
3. Double-Barreled Questions
Error: When posing two questions in a single question, it may confuse the respondents and may also give discrepant or incorrect responses.
How to Avoid:
- Split complicated questions into two distinct and clear questions.
- Simple and single-focus questions that are easy to understand should be used.
Example: Do not ask: How satisfied are you with our product quality and speed of delivery? Ask:
- To what extent are you satisfied with the quality of our products?
- What is your satisfaction with our delivery speed?
4. Long Surveys Without Time Estimates
Error: It causes mid-survey fatigue when participants give up long surveys without knowing the duration, and abandon it.
How to Avoid:
- Make surveys short: email surveys should not exceed 10 questions.
- Add an approximate estimated time of completion at the top of the survey.
- The most important questions should be prioritized in the first place.
Sample: A retailer shortened his feedback survey to 7 questions and included the text 5-minute survey at the top. Breakoff dropped from 30% to 12%.
5. Ignoring Mobile UX
Error: Surveys that are not mobile-friendly annoy end users and raise abandonment.
How to Avoid:
- Make surveys mobile friendly and have clear navigation and buttons that are easily tapped.
- And do not use long text and cluttered layouts.
- Conduct a test survey on various devices prior to deployment.
Example: A brand observed an increase in the abandonment rate of mobile surveys by 25%. The completion rates increased by 18 by making the design simpler and providing a progress bar.
6. Failing to Personalize or Segment
Error: Sending random surveys to all people will lead to more irrelevant questions which will result in mid-survey fatigue.
How to Avoid:
- Divide the respondents into segments based on their behavior, demographics, or level of engagement.
- Customize questions based on experience or interest of the segment.
- Skip logic should be used to display question which are not applicable.
Sample: Dissimilar surveys were given to new and returning customers. The completion rates rose to 80 percent as opposed to 55 percent and the breakoff rates were reduced.
7. Not Closing the Feedback Loop
Error: The respondents will feel that their contribution is not important when they will never see the results and will become tired and disinterested in the survey.
How to Avoid:
- Provide participants with survey results through emails or dashboards.
- Showcase activities done in accordance with feedback.
- Reinforce value with personalized thank-you messages.
Sample: The survey turn-out in the subsequent survey rose by 15 percent after the revelations of the customer feedback and the intended improvements were shared.
Conclusion
The issue of survey fatigue is also an easy to encounter problem that may compromise the accuracy and reliability of your survey data. Knowing what survey fatigue is, when it occurs and why it occurs, will allow you to take proactive measures to reduce survey fatigue.
By applying such measures as auditing survey cadence, short surveys, smart design, personalization of questions, value, testing incentives, and quality monitoring, you will keep your respondents engaged. Practical experience demonstrates that even minor enhancements such as surveys being shorter or having skip logic can greatly increase the completion rates and decrease breakoff.