Absenteeism rate is a measure of the frequency of absent workers. The rate of absenteeism is considered a significant measure of workforce stability.
Given that, in today’s world, work processes and work environments are hybrid or distributed, recognizing and monitoring employee attendance patterns is becoming increasingly difficult. Additionally, the cost of unplanned employee attendance is rising in all sectors.
High absenteeism figures not only affect productivity. They have many other effects that, if properly understood, can help organizations address emerging issues before they become too serious.
What Is the Absenteeism Rate?
Absenteeism rate refers to the percentage of scheduled hours that are lost due to unplanned absences. It is a simple method of determining the frequency of non-availability of employees to report to work.
This figure generally comprises several different types of absences:
- Unplanned sick days without advance notification
- Frequent short absences that create a pattern.
- No call, no show
- Last-minute time-off requests
However, the meaning of the percentage for the absenteeism rate is more than just the number of missing days. It doesn’t measure the underlying causes of under-engagement, exhaustion, or substandard performance.
What absenteeism doesn’t include:
- Approved vacation time
- Scheduled Medical Appointments
- Bereavement or Family Emergency Leave with Proper Notice
- Company holidays or planned shutdowns
Assessment of criteria for absenteeism is useful in defining the actual calculation of absenteeism; otherwise, your figures won’t represent the reality of absenteeism.
Why Tracking Absenteeism Rate Matters More Than Ever
The rate of employee absenteeism has a direct impact on your bottom line. Every unplanned employee absence has a ripple effect.
The end result is that projects are behind schedule due to missing team members. The others have to compensate for these missing team members, and this breeds resentment and possibly burnout for these workers. Supervisors are catering to scheduling rather than moving the company forward strategically.
The real cost shows up in:
- Lost Productivity due to Incomplete Tasks
- Overtime pay for replacement workers
- Delayed Project Deadlines
- Lower Team Morale and Engagement
- Increased stress on the existing employees
What leaders often miss is that absent employees are not necessarily the problem; rather, a high rate of absenteeism often reflects other issues within the workforce.
Tracking this metric helps you see the early warning signs. You might detect a problem before a workforce stability problem arises.
What Is the Average Absenteeism Rate?
The average rate of absenteeism differs across industries and work environments. Most organizations experience rates that range from 1.5% to 3% per year.
A typical good absenteeism rate is less than 2%. This allows for the occasional illness and legitimate emergency. Anything over 3% indicates deeper problems that need to be addressed.
High absenteeism rates generally exceed 5%. At this rate, absence patterns significantly affect operations and should trigger immediate investigation.
Attention to industry differences:
- Healthcare and manufacturing show higher percentages due to the physical demands: 3-4%.
- The percentage rates are lower for office-based jobs, ranging from 1.5 to 2.5%.
- Other remote teams may manifest different trends, but possibly, their absence could be invisible yet higher.
What acceptable absenteeism rates should be for our organization? This is dependent on the context. Approval comes from comparing with industry averages, but also with an understanding of the trends.
Calculating the Absenteeism Rate Correctly
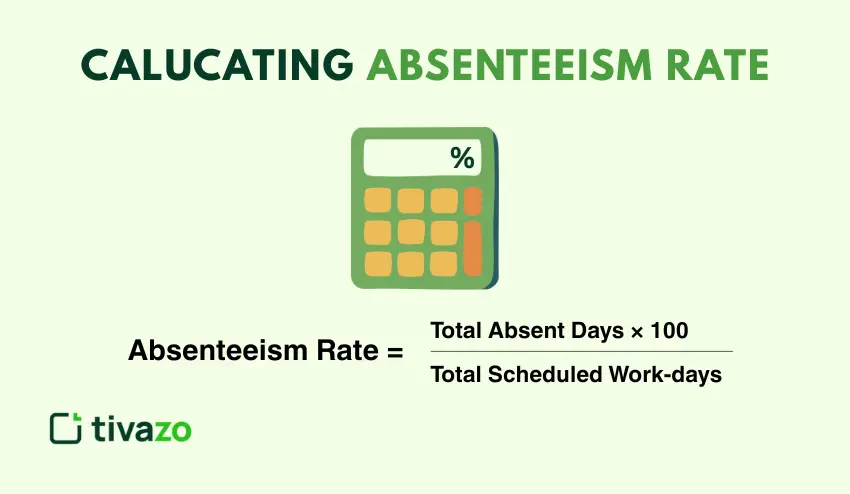
The formula for the rate of absenteeism, however, is simple; it just needs accurate data. Here is the normal calculation:
Absenteeism Rate = Total Absent Days / Total Scheduled Work-days × 100
You will require the following to correctly calculate the absenteeism rate:
- Total number of unplanned absence days in the period
- Total number of scheduled workdays for all employees
- Clear definition of what constitutes an absence
Common mistakes made that give bias to results:
- Not counting partial day absences, ditching early or late
- Mixing projected and unplanned leaves in the same calculation
- Using unequal time periods among teams
- Rely on manual attendance tracking that misses attendance patterns.
Here is how to calculate the absenteeism rate if the data is clean. First, define your measurement period, which can be weekly, monthly, or annual. Then, provide complete time and attendance information for the time period in question. Next, apply the formula consistently to all teams:
Manual tracking creates gaps in your data: spreadsheets miss partial absences and don’t flag patterns. You need reliable systems that capture actual work time to accurately calculate leave entitlements.
Absenteeism Rate Examples in Real Work Scenarios
The understanding of the formula will improve if we examine some actual absenteeism rate examples. Let’s analyze three different cases.
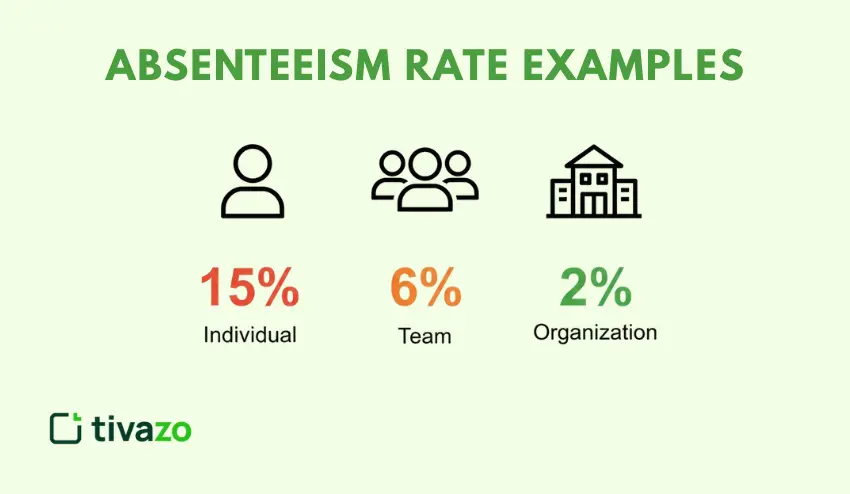
Example 1: Individual Absenteeism Rate
Sarah works 20 days per month. In March, she missed 3 unplanned days due to sickness.
Her individual percentage rate = (3 ÷ 20) x 100 = 15%
This high number indicates a trend that warrants further examination. Is Sarah struggling with a chronic health issue? Is stress from the workplace sapping her immune system? By tracking employee-level data, managers can have open discussions with workers more quickly than if they only used business-level data.
Example 2: Team Absenteeism Rate
The customer service team consists of 10 staff members who work 200 days at large per month. Last month, the team gathered 12 unplanned absence days.
Team absenteeism rate = (12 ÷ 200) × 100 = 6%
At 6%, this is a cause for concern on this team. It would tend to snowball, as other members would then have to cover extra calls, which in turn would increase their level of stress. And so the downward spiral continues.
Example 3: Organizational Absenteeism Rate
A company with 100 employees would have 2,000 scheduled workdays in a month. They recorded 40 unplanned absence days.
Organizational absenteeism rate = [40 / 2,000] × 100 = 2%
A 2% rate is considered within the healthy range. However, leadership still has cause to review distribution. Are absences concentrated in certain departments or roles?
Absenteeism Rate vs Absence Frequency
These two measures are concerned with different facets of employee attendance. A complete picture is achieved when both are considered.
“Absenteeism rate” indicates the total percentage of time lost due to absenteeism. “Absence frequency” is the sum of the total number of absences, irrespective of the duration of the absences
For instance,
- Employee A: 1 incident, 5-day absence
- Employee B: Five days of absence, each 1 day in duration
This is true, considering that the two employees missed the same cumulative number of days. Their employee absenteeism probability also turns out to be the same. However, the rate at which Employee B is absent is five times higher
Why track both metrics?
Absenteeism rate indicates the extent of the impact on productivity. Higher rates translate to greater time loss. Absence frequency helps identify patterns and policy misuse. Frequent short-term absences may signal different concerns from infrequent extended absences.
Frequency can particularly uncover issues that are masked by averages. For example, an employee with many short absences may have engagement issues, while an employee with one long absence may have recently needed surgery.
Both must be monitored by the organization. These provide context that is not supplied by the individual metrics alone.
What Causes a High Absenteeism Rate?
Generally speaking, many reasons contribute to high rates of absenteeism. Most often, there are multiple causes rather than a single one
The most common drivers include:
- Burnout because of sustained overwork and the absence of breaks
- Poor workload visibility, leading to non-uniform work distributions
- Lack of clear accountability and expectations
- Disengagement or lack of connection with the work being done or the purpose of
- Numerous inefficiencies in the scheduling process cause frustration
- Health concerns regarding workplace stress
- Toxic team dynamics or management
Guessing at reasons without statistics is not a good plan. Laziness could be burnout. Lack of engagement could be due to vagueness.
Physical factors at work also play a part:
- Uncomfortable work environment
- Long travel times that consume energy
- Inflexible schedules that clash with personal needs
- Insufficient sick leave policies
Problem: Organizations are often forced to act to address high employee absenteeism when the situation has become critical. However, at that point, the underlying factors have been accumulating in the organization for some months.
Early detection calls for constant tracking and recognition of patterns. You need to see when absence rates are rising, not when they’re peaking.
How Visibility Into Work Patterns Helps Reduce Absenteeism
A great majority of absences are caused by hidden problems that become visible too late. It can help to recognize true work patterns.
The following are common scenarios:
If the load on employee resources is high, yet undefined, the result is burnout, followed by time off work. Where there are inequalities in the way work is distributed amongst a team or group, some people are overloaded while others are underloaded. Unclear expectations result in a stressed or disengaged workforce.
Better visibility means tracking:
- Actual hours worked, not the scheduled time
- Productivity Trends that Show Declining Output Before Absence
- Consistency patterns that show when someone is struggling
The visibility is provided by time-tracking software, which displays live statistics about who is working on what, for how long, and with what result.
However, that access needs to be supported by timely and accurate data. Manual records and quarterly reviews don’t capture changes.
Practical Ways to Reduce Your Absenteeism Rate (Without Punishment)
Reducing absence requires addressing the reasons behind it, not merely enforcing attendance policies. punish-based approaches often backfire.
Here’s what actually works:
Identify patterns rather than waiting till late
Review attendance records every week or two. Be on the lookout for emerging trends well before they reach crisis level. Early communication about small issues can ward off bigger problems later on.
Balancing Workloads Based on Real-World Usage
Don’t assume work is distributed evenly. Look at how much time is being spent, and if there are imbalances, redistribute work.
Increased accountability through transparent tracking
Of course, if we can see the patterns of work in relation to ourselves as well, then we can develop more self-awareness. We make adjustments when we can see the patterns of our own work.
Manage Burnout Before It Becomes an Absence
Watch for signs of decreased productivity, longer hours without success, or emotional exhaustion. Intervene in these cases.
Supporting employees through data-driven decisions
Use data you’re already tracking around attendance and work patterns to inform discussions with your staff. Instead of making assumptions, leverage that data. Engage your people in the patterns you’re seeing, and work together to address these areas.
Additional strategies that help:
- Compliant work scheduling for personalized needs
- Clear communication of expectations and goals
- Benefits of Rewards for Consistent Attendance and Performance
- Mental health resources and wellness programs
If you concentrate on how to prevent absenteeism, absenteeism itself is reduced.
Measuring Absenteeism Rate Over Time
A one-time measurement tells you almost nothing. Trends show you the real story.
It may be an unusual rate for that one particular month because of illness. This is normal. However, an increase in three successive months in the rate of absences could be cause for concern.
Regularly monitor absences every month and the patterns each quarter. Identify:
- Seasonal patterns (Higher rates in flu season or summer)
- Department-specific trends (one department is consistently higher than the others)
- Changes after organizational shifts (after restructuring or a change in leadership)
- Different personal patterns that may require assistance
Continuous tracking enables the stability of the whole workforce over time. You establish a baseline for the business and can easily identify any deviation.
Compare the rates to:
- Your historical average
- Industry benchmarks
- Individual Department Baseline
This comparison will help put things in perspective. A 3% interest rate might be alarming in terms of your working staff, but it’s normal for your warehouse crew.
Another benefit of regular measurements is that they can be useful in monitoring interventions. When you introduce a new program aimed at improving wellness in your body, you can measure its success.
Conclusion
Absenteeism Rate: The absenteeism rate is a vital sign of health for a workforce. Understanding how to calculate this figure can help you identify issues.
The key isn’t just the rate; it’s the use of that information to address the causes. Emphasis shifts to workload balance, expectations, and interventions rather than disciplinary action.
Continuously monitor patterns, measure against a baseline, and take action when patterns have emerged. This will not only improve employee absenteeism but will also result in a more secure and loyal workforce.