Have you ever experienced an increase in a project budget due to wasted money on scope adjustments, project managers, late fixes, or customer complaints? The Cost of Quality (CoQ) is the hidden costs that eat away at value to your project. With an abundance of focus on deadlines and budgets, many teams overlook how poor quality can silently consume resources.
Calculating and understanding the indirect costs of CoQ isn’t really an accounting process. It’s really a process of protecting profits, client trust, and team efficiency. In this guide, we will discuss what CoQ is, why it matters, and offer project managers tips on how to calculate and minimize CoQ.
What is the Cost of Quality (CoQ)?
The Cost of Quality (CoQ) is the total investment in delivering a product or service that meets the customer’s expectations. CoQ is more than fixing mistakes; it is all of what you invest in preventing, detecting, and correcting quality issues over the lifecycle of the project.
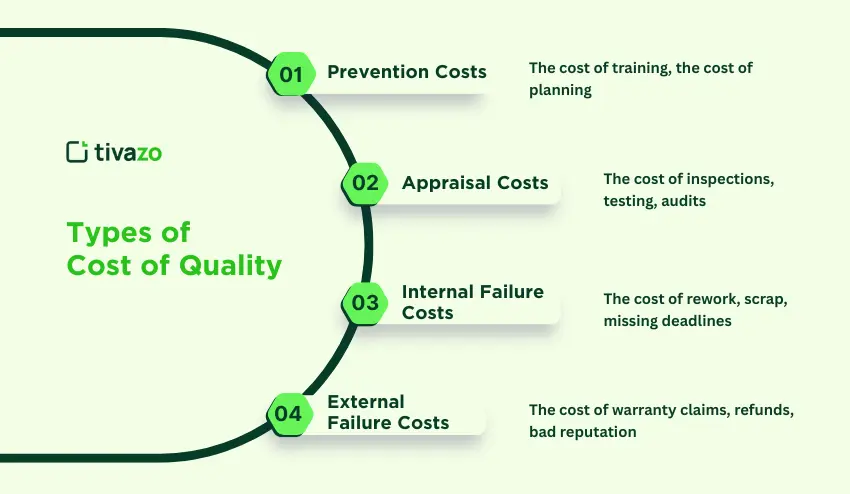
- Prevention Costs – the cost of training, the cost of planning, the cost using quality tools to eliminate errors before they happen.
- Appraisal Costs – the cost of inspections, testing, audits to ensure that we are meeting standards.
- Internal Failure Costs – the cost of rework, scrap, missing deadlines when we find the defects before we deliver.
- External Failure Costs – the cost of warranty claims, refunds, bad reputation when we found defects after the customer caught them.
CoQ = The Cost of Doing Things Right (prevention + appraisal) + The Cost of Doing Things Wrong (internal + external failures).
CoQ vs COPQ (Cost of Poor Quality)
Although concepts that sound alike, CoQ and COPQ refer to different things:
- Cost of Quality (CoQ) is a complete view – all of the costs of achieving quality, both the good (prevention and appraisal) and the bad (failures).
- Cost of Poor Quality (COPQ) is a subset of CoQ – it accounts only for the costs of doing things wrong, costs associated with rework, customer complaints, lost sales, or damaged brand equity.
💡 Think of it this way:
- You pay costs in prevention and appraisal when achieving good quality (costs of good quality).
- If you skip or ignore those costs, the amount of costs associated with failure will be greater, (costs of poor quality).
This is why smart project managers track both CoQ and COPQ to make quality an investment instead of a cost.
The Four Categories of CoQ (with Examples)
| Category | Description | Example in Projects |
|---|---|---|
| Prevention Costs | Efforts to avoid defects before they occur | Training, design reviews, process improvements |
| Appraisal Costs | Costs of measuring and monitoring quality | Testing, audits, inspections |
| Internal Failure Costs | Costs from defects found before delivery | Rework, scrap, schedule delays |
| External Failure Costs | Costs from defects after delivery | Warranty claims, refunds, lost clients |
How to Calculate Cost of Quality (Step-by-Step)
- Identify costs in each category (prevention, appraisal, internal failure, external failure).
- Formula: Cost of Quality (CoQ)= Prevention Costs + Appraisal Costs + Internal Failure Costs + External Failure Costs
- Add them together:
Formula: Cost of Quality (CoQ)= Prevention Costs + Appraisal Costs + Internal Failure Costs + External Failure Costs
Example:
- Prevention: $10,000
- Appraisal: $15,000
- Internal Failures: $8,000
- External Failures: $5,000
👉 Total CoQ = $38,000
5 Ways to Win by Managing the Cost of Quality
Effectively managing the Cost of Quality (CoQ) isn’t just about tracking expenses—it’s about turning quality into a strategic advantage. Here are five ways project managers can win:
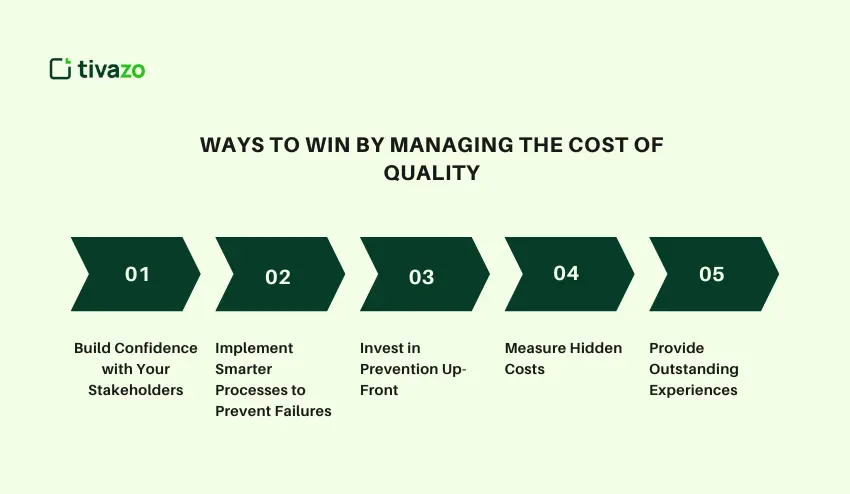
Build Confidence with Your Stakeholders
When you are able to demonstrate some modicum of control over quality, and CoQ/ Total CoQ, we will have stakeholders who have the confidence to proceed because they aren’t left wondering where the next project plan is going to come from! When we can persistently crest CoQ with an objective set of tracking practices, it will signal good governance and the general tone of risk management across a project.
Implement Smarter Processes to Prevent Failures
With shift-left testing, automation, cross-functional training, and key performance indicator (KPI) monitoring, it is possible to identify errors and lessen waste and inefficiencies. Not only do smarter processes lessen the total cost of poor quality, they also enhance speed and reliability.
Invest in Prevention Up-Front
Investing in upfront solutions such as training, design reviews, or quality tools will ultimately save you money and expense because you are trying to fix at a later date if you do misspeak. Prevention is not an expense it is an investment that gives you a benefit cost of up to a 2:1 or higher return on investment (ROI) because it eliminates rework, delays, or external quality failures and damage to your reputation.
Measure Hidden Costs For Improved Spending
Identifying and well-calculating internal quality failures, rework, and other quality-related delays that have not been quantified will allow you to get a better view of the true financial impact of poor quality. The main benefit is to have more predictability with your budget and far fewer surprises during the execution phase of the project lifecycle.
Provide Outstanding Experiences for Customers
Each defect that we eliminate during the process avoids a problem which translates directly to unsatisfied clients, complaints, terminated contracts, and loyalty. All of these things contrive to protect your reputation; high quality deliverables enhance your reputation, and they can also result in repeat business.
Benefits of Tracking CoQ in Project Management
When project managers track Cost of Quality (CoQ), they are not merely tracking expenses, but understanding information that relates directly to profitability, timelines, and customer trust and better management of project. This is critical to managers for the following reasons:
1. Reduce Overall Costs
A problem during the design process only costs a couple dollars to fix. A problem fixed during production costs thousands. A problem that makes it to a customer, could mean, revenue loss, refunds, and tarnished reputation.
By tracking CoQ, you enable yourself to buy prevention when it is cheap, instead of swapping the cost of failure when it is too late.
2. Improve Budget Predictability
Projects typically fail not due to a lack of resources, but because of the hidden costs of quality – rework, delay, claims, etc. When managers quantify CoQ, they bring forth insight on the hidden costs of quality, which allow the manager to better plan a budget, and avoid ugly budget surprises down the road.
3. Boost Customer Satisfaction
Every defect avoided is one less complaint, one less request for repayment, and one happy customer. When teams spend money on quality up front, the end-user has a better experience, resulting in loyalty and continued business.
4. Strengthen Stakeholder Trust
Stakeholders such as investors, clients, and executives desire predictable outcomes. If you can show stakeholders that your team can track and control CoQ, that means you can effectively manage risks to organizational reputation and satisfaction, which fosters trust and builds your credibility as an organization that emphasizes quality.
Common Mistakes in Managing CoQ
Whether or not organizations properly track the Cost of Quality (CoQ), many continue to struggle to optimize their investment because they still make a few avoidable mistakes. Here are the most frequent:
1. Only Tracking Visible Failure Costs
A number of managers only measure the obvious costs, which include product recalls and warranty claims, for example; yet they neglect to calculate the hidden costs (e.g. delays, rework hours, lost productivity, damage to reputation). When organizations fail to account for costs associated with quality, they often underestimate the costs associated with a poor quality product. In fact the hidden costs often multiply the visible costs.
2. Believing Prevention is “Too Expensive”
If I close my eyes while driving, there’s potential for a good outcome despite not taking preventative measures; however, any good outcome likely cost more in time, efficiency, and safeguard. Furthermore, not taking preventative measures frequently results in much higher costs later. For example, a defect addressed at the design stage may cost $100 dollars to prevent, yet if that defect is addressed after launch, it may severally cost tens of thousands of dollars. Prevention is not an expense it’s an investment with a significant return on investment.
3. Treating Quality as a One-Time Activity
Quality is not something you “check” at completion of the project. Quality must be incorporated as a part of every Phase, Planning, Design, Development, Testing, as well as Delivery. If organizations perform a Quality check when the project is complete, by then, the symptoms will be neglected, and the defect will be magnified.
4. Failing to Involve the Whole Team
Quality cannot be placed solely on the QA department or project manager. Quality should be defined by everybody from developers, designers, suppliers, including the customer. If everyone is not accountable for quality, the burden is carried by a few and defects are undetected.
How to Reduce the Cost of Poor Quality
Cost of Poor Quality (COPQ) means all the money wasted by rework, failures, delays, refunds, and dissatisfied customers. Several aspects of COPQ can never be reduced to zero, but clever and savvy project managers can reduce COPQ by embracing prevention and smarter processes. Here are some ways to reduce the COPQ:
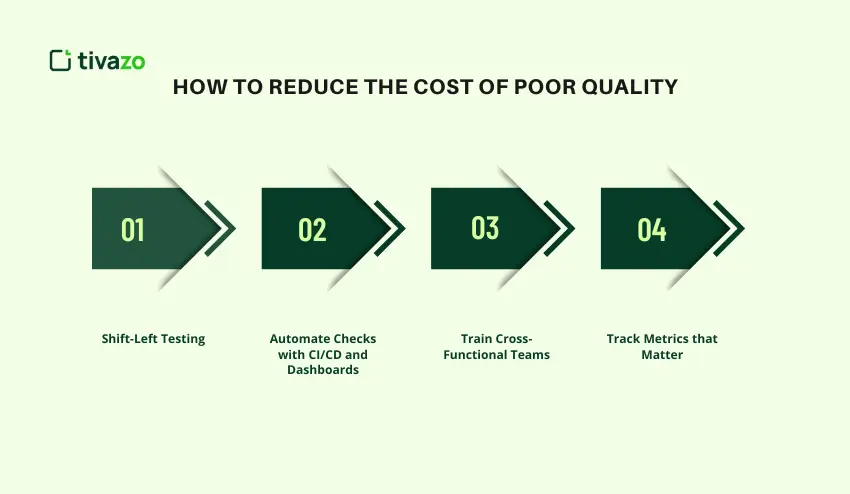
1. Shift-Left Testing: Detect Defects Earlier
The sooner an error is detected, the cheaper it is to fix.
- In software, this can occur by including unit tests and code review during work such that quality is considered and in place before release.
- In construction, it means validating designs and materials before they hit the site.
👉 Catching defects “on the left side” of the timeline prevents expensive fixes on the right.
2. Automate Checks with CI/CD and Dashboards
User-involved inspection is the slowest pace with the highest potential for human error. Automation provides uniformity and can scale for quality.
- Set up CI/CD pipelines and run automated tests for every code push.
- Set up to identify anomalies in performance, quality, or costs with a real-time dashboard.
- Automate the reporting so project managers can see easily determine trends for quality.
3. Train Cross-Functional Teams
Quality is more than a QA team’s responsibility. Designers, developers, and engineers, even customer support need to know how their work impacts CoQ.
- Conduct short, role-based, training sessions.
- Build a way to share knowledge across teams.
- Create a “quality-first” culture which inspires ownership and outcomes.
4. Track Metrics that Matter
Numbers hold teams accountable. You can track the leading indicator, and predict and prevent a problem before it becomes a problem.
Key quality metrics include:
- Defect Density → number of defects per size of deliverable (e.g. per 1,000 lines of code).
- First pass yield → the percentage of work items completed without rework.
- Rework Rate → the percentage of tasks sent back for correction, as rework and corrections cost money.
- Customer Complaint Rate → an early indicator of external failures.
Tools and Templates for Project Managers
Managing the Cost of Quality (CoQ) becomes much easier when project managers have the right tools at hand. Instead of relying on guesswork, you can use structured templates and dashboards to track quality in real time.
Tivazo CoQ Calculator
This is a simple Excel/Google Sheet calculator that breaks down CoQ into four separate areas – prevention, appraisal, internal failure, and external failure -so by completing your template you can quickly see how much time and money you are making or losing!
Timesheet Templates
Tivazo’s ready-made timesheet templates help teams log prevention work vs. rework hours. This makes it easy to spot trends and shift more effort into prevention, which saves money in the long run.
Real-Time Dashboards
Dashboards take raw data and consolidate it for clearer insights. You can view defect trends, rework costs, and quality KPIs at a glance which makes the opportunity to take action sooner, and also allows the opportunity to demonstrate to your stakeholders return on investment in quality initiatives.
Cost of Quality vs Other Quality Management Concepts
Cost of Quality (CoQ) is often misinterpreted with the other quality management concepts. Here is how it relates — and differs, to the most prevalent concepts:
🔹 CoQ vs Six Sigma
- Six Sigma: a data-driven approach to reduce defects in execution of deliverables.
- CoQ: key indicator that is among the key metrics in a Six Sigma project to assess financial impact of quality initiatives.
- Consider CoQ to be the money scoreboard in showing if Six Sigma projects add business value.
🔹 CoQ vs TQM (Total Quality Management)
- TQM: a broader management philosophy framed for embedding quality into culture, leadership, and continuous improvement.
- CoQ: measurement approach that quantifies the cost of achieving (or not achieving) that quality.
- TQM = mindset , CoQ = measurement .
🔹 QA vs QC vs CoQ
- Quality Assurance (QA): Process-driven approach → focused on preventing defects.
- Quality Control (QC): Output-driven approach → focuses on detection of defects in output .
- CoQ: The cost model that encompasses costs incurred for both prevention (like QA, or quality assurance) and detection (like QC, or quality control), and also costs incurred by failures.
- QA and QC define what we are doing to create quality, while CoQ shows us how much it is costing us.
Key Metrics & KPIs for Tracking CoQ
To manage the Cost of Quality (CoQ) effectively, project managers need measurable indicators. The key performance indicators (KPIs) help you to see where money is being spent, where the problems are, and provide data to make decisions that will reduce costs.
1. Defect Density
Measures the number of defects based on the size of your deliverable (based on e.g. per 1000 lines of code, per batch of products, etc.).
👉 The higher the defect density, the greater the impact on quality and likely failure costs.
2. First-Pass Yield (FPY)
The proportion of products or deliverables that meet quality standards without rework.
👉 The low FPY (54%) indicates inefficiencies of the process and increased cost of internal failures.
3. Cost of Rework
The total cost incurred to fix defects that were identified prior to delivery.
👉 Tracking this will demonstrate the financial impact of your internal failures, and encompass justification for prevention practices.
4. Customer Complaint Rate
The number of complaints received from customers per period or per project.
👉 A high complaint rate directly translates to external failure costs and can affect reputation.
5. CoQ as a % of Project Revenue
This measures the amount of total project revenue spent on quality-related costs (prevention, appraisal, and failures).
👉 It gives managers a comparative view of whether their investments in quality measures are measured against the size of the project and anticipated Return On Investment (ROI).
Industry Benchmarks for Cost of Quality (CoQ)
Understanding how your CoQ fits within the industry benchmarks, exposure to where inefficiencies might exist, and setting reasonable quality targets are important. There is a wide-gamut to the “ideal” amount of CoQ depending on the sector, but here are a few commonly used benchmarks:
Manufacturing
- Typical CoQ: 15 to 20% of revenue
- Costs of quality fall into three categories: prevention (training, inspection plans), appraisal (testing, vendor audits), and failure (scrap, rework, warranty claims).
- Manufacturers with high-volume and standardized processes focus on process control (such as automation or preventive actions) to minimize internal failures..
Software & IT Projects
- Typical CoQ: 25 to 30% of costs
- Costs of quality due to fixing defects, defects found via testing, customer support (warranties), and cycle time (time lost in delays).
- Agile and DevOps teams reduce CoQ by moving the breaks left in the life cycle by adopting continuous team integration within those life cycle stages.
World-Class Organizations
- The best-in-class organizations strive to keep CoQ to less than 10% of total revenue or project cost.
- They do this by embedding quality in the culture of the organization, making a commitment to prevention expenses in the base budget, and proactively managing activities that decrease the KPIs we measure.
- Lowering CoQ not only saves the organization money, but it will also strengthen customer trust and competitive advantage.
💡 Pro tip: Use these hints as a guide for benchmarking performance and not as a hard and fast rule. Compare your CoQ with peers in your industry. Where are the greatest costs coming from? (Prevention, appraisal, internal, or external failure).
Future of Cost of Quality in Project Management
Organizations continue to develop and evolve how they manage the Cost of Quality (CoQ). As emerging tools and more advanced analytics are available, CoQ tracking is evolving from being simply reactive accounting to proactive quality management. What does the future look like?
- AI-powered quality prediction.
- Real-time dashboards from something like Tivazo.
- Predictive analytics for defect prevention.
- Automation-first strategy.
Conclusion
The Cost of Quality is not merely a project management metric; it is the invisible force that guides the budget, timelines, and reputation of your project. Tracking and reducing CoQ allows organizations to shift to managing quality as a profit center rather than a cost center.