If you are running a business without a performance dashboard, then it is like driving a car without opening your eyes. Yes, you will be moving forward, but you will never know where you are heading or what is coming next on your way.
This is where performance dashboards come into play. These tools will give you a clear view of how your business and team are performing. In 2026, companies using these tools will be making quick decisions, resolving issues on time, and staying ahead of their rivals.
This guide will give you a comprehensive overview of everything related to performance dashboards.
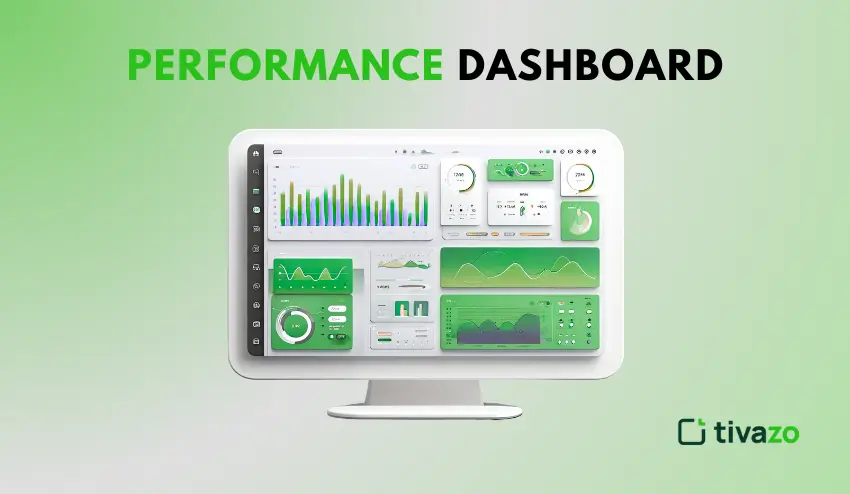
What Is a Performance Dashboard?
A performance dashboard is a visual representation of your business metrics in one place. It displays your key performance indicators (KPIs) in real-time using charts, graphs, and numerical values.
A performance dashboard is your business’s control center. You don’t need to search for information in multiple reports and spreadsheets. You can see all your business’s key information in one place.
The key difference between dashboards and reports is the speed and ease with which information is delivered. Reports are based on historical information and are updated manually.
Dashboards are based on current information and are automatically updated. This allows you to take action based on the information you see, not days or weeks later.
Real-World Dashboard Applications
Sales teams use dashboards to track daily sales revenue and conversion rates. Marketing departments use dashboards to track their marketing campaign effectiveness, as well as website traffic.
HR departments use dashboards to track their employees’ attendance rates. Operations managers use dashboards to track their workflow efficiency rates.
Why Performance Dashboards Matter in Today’s Workplace
In 2026, business is a fast-paced environment. Waiting for a monthly or quarterly report will only make you fall behind your competition. With performance dashboards, you will be able to gain the visibility you need to remain at par with your competition.
- Faster decision-making: With performance dashboards, you will be able to identify a drop in productivity or a problem and make a decision on the spot instead of waiting for a report.
- Improved productivity: With performance dashboards, everyone will be aware of their productivity and will be able to identify tasks that will yield better results.
- Greater transparency: With performance dashboards, everyone will be aware of what is going on. This will help create a sense of trust in the organization.
- Greater accountability: With performance dashboards, everyone will be aware of what is going on.
Key Components of an Effective Performance Dashboard
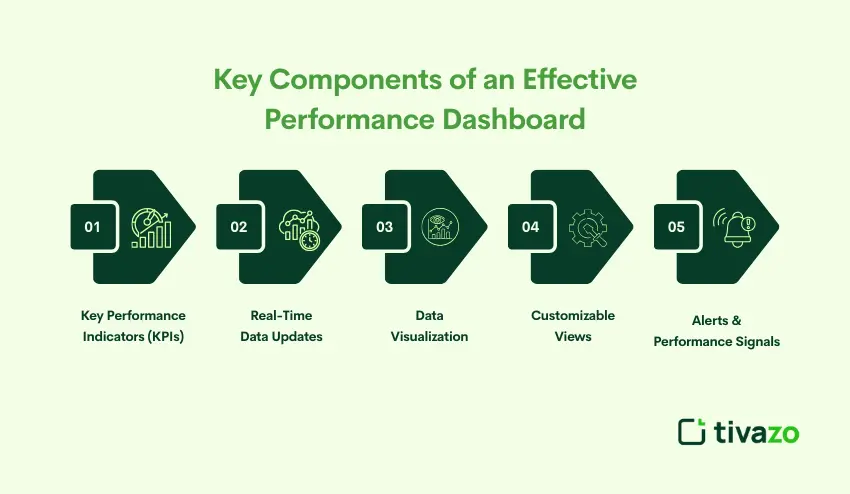
To create an effective performance dashboard, you need the right elements to come together. Without one of these elements, your performance dashboard may become confusing or useless.
Key Performance Indicators (KPIs)
KPIs are the most important metrics that help you achieve your business objectives. A good performance dashboard displays 5-10 key KPIs, not all possible metrics.
Select KPIs that are directly linked to your business results. Revenue per employee, customer satisfaction ratings, and project success rates are examples of key KPIs. Unimportant metrics such as total page views or total social media followers are examples of vanity metrics that can mislead you from what is important.
Real-Time Data Updates
Old data can result in poor decision-making. Your performance management dashboard should update automatically, reflecting the latest data without needing human intervention. Most contemporary performance dashboards update every few minutes or hours, depending on the data sources.
Real-time analytics enable you to act on changes as they occur. If your website traffic increases, you will be aware of it immediately. If your team’s productivity falls, you can analyze the reason for the decline as it happens.
Data Visualization (Charts, Graphs, Heatmaps)
Numbers do not tell the whole story. Visual data also plays an important part in processing information and recognizing patterns instantly. Bar charts can be used to compare data. Line graphs can be used to show trends and patterns over time. Heatmaps can be used to point out problem areas.
A good data visualization can make complex data simple and easy to understand. A good analytics dashboard can be used to explain complex data and analytics concepts to anyone, irrespective of their level of technical knowledge.
Customizable Views
People have different needs when it comes to data. Business leaders need data on strategic metrics. Team leaders need data on operations. Individual contributors need data on personal performance tracking.
A good analytics solution should be able to provide customization views. This ensures that the solution does not become outdated and that people are able to focus on the data that is most relevant to them.
Alerts & Performance Signals
You can’t sit in front of a dashboard all day. Alerts notify you when your metrics reach critical points. Revenue falling below a goal? Get a notification. Employees performing better than expected? Enjoy the victory.
This feature helps you prioritize your attention on where it’s needed most. You can get on with your other tasks while being alerted to where attention is required most.
Different Types of Performance Dashboards
Not all dashboards serve the same purpose. The type of dashboard required depends on the objective and intended use.
Strategic Performance Dashboard: This type of dashboard is used to track long-term goals and company objectives.
Operational Performance Dashboard: This type of dashboard is used to monitor daily business activities such as production outputs.
Analytical Dashboard: This type of dashboard is used to explore the data and identify trends and insights.
Employee Performance Dashboard: This type of dashboard is used to improve transparency and employee motivation by tracking employee and team productivity.
Sales & Marketing Dashboard: This type of dashboard is used to track revenue and business growth.
Performance Dashboard vs KPI Dashboard (Quick Comparison Table)
Many people find themselves using these terms interchangeably, but they are used for different reasons. Knowing the difference between the two will help you create the proper tool for your needs.
| Feature | Performance Dashboard | KPI Dashboard |
| Scope | Broad view of multiple metrics | Focused on core KPIs only |
| Data | Various performance indicators | Specific key metrics |
| Usage | Daily operations and monitoring | Strategic goal tracking |
| Audience | Teams and managers | Executives and leadership |
| Update frequency | Real-time or hourly | Daily or weekly |
| Detail level | Comprehensive metrics | High-level summaries |
A performance dashboard is the complete view of how your business is operating. A KPI dashboard is a focused view of the few key metrics that will lead to success.
Benefits of Using Performance Dashboards
A business performance dashboard implementation will give you numerous benefits within your organization. These benefits will compound over time as your team becomes more data literate.
- Saves time: Gives you instant access to up-to-date information without having to manually create reports.
- Helps with goal orientation: Reminds teams to focus on what matters by keeping them aware of important metrics.
- Boosts productivity: Increases awareness and accountability, thus enabling self-tracking.
- Promotes collaboration: Offers teams data to work towards common goals and challenges.
- Provides real-time insights: Enables you to be aware of opportunities and challenges, thus helping you to act on them in real-time.
- Reduces operational expenses: Enables you to spot inefficiencies and optimize resource allocation.
How to Build a High-Impact Performance Dashboard (Step-by-Step)
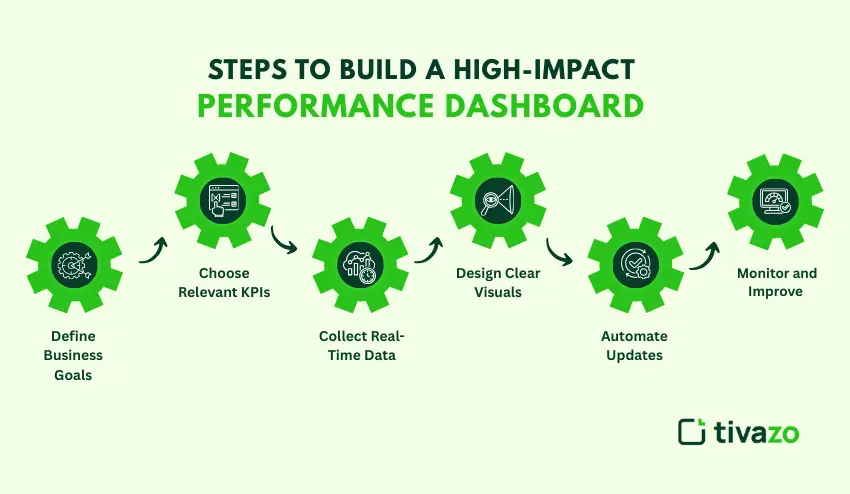
In order to design a high-impact performance dashboard, planning and implementing the process in a step-by-step manner is a requirement. The following are the steps in making something useful to your team.
Step 1: Define Business Goals
Identify your priorities, be it business revenue, productivity, or customer satisfaction and form the basis of the metrics you measure.
Step 2: Choose Relevant KPIs
Choose 5-10 of your most important performance measures of how you are achieving your business goals. Don’t track unnecessary data.
Step 3: Collect Real-Time Data
You can connect your dashboard to your business applications, including customer relationship management, project management, and time-tracking software, to guarantee the correct record-taking, which is automated.
Step 4: Design Clear Visuals
Trends, comparisons, and status should use line graphs, bar graphs, and gauges or numbers, respectively. Make your dashboard design simple and easy to read.
Step 5: Automate Updates
Have the metrics in your dashboard automatically updated; this way, you will have the latest and up-to-date information.
Step 6: Monitor and Improve
Collect feedback, keep outdated metrics, and introduce new insights with a continuously changing business. A business dashboard must evolve and be enhanced with time as your business expands.
Best Practices for Performance Dashboard Design
A good performance dashboard should display key metrics in an efficient manner while promoting quicker decision-making. A good performance dashboard design can lead to increased usability, engagement, and productivity.
Simple and Focused Design: A good design should display only essential performance metrics. This ensures that users can quickly understand the insights provided by the dashboard without any distractions.
Actionable KPIs: It is essential to track key performance indicators (KPIs) that can be directly influenced by teams. This ensures that actions lead to significant results.
Data Overload: It is crucial to avoid data overload on the dashboard by displaying fewer graphs. Complex data can be divided into operational dashboards, analytical dashboards, and strategic dashboards.
Visual Hierarchy: It is essential to display critical metrics in a prominent manner. Critical performance indicators should be able to grab the user’s attention by default.
Real-Time Updates: It is crucial to update the performance dashboards in real-time. This can increase trust in the system.
Common Performance Dashboard Mistakes to Avoid
Even with the best intentions, performance dashboards can be ineffective if not properly structured.
Too many metrics tracked
Too many KPIs can be overwhelming. Only focus on high-impact performance indicators.
Lack of definition for the dashboard’s goals
Each performance dashboard should have defined questions that are answered. Start with the goal and then select your metrics.
Poor usage of data visualization techniques
Inaccurate usage of charts and other visualization techniques makes it difficult for users to understand the information presented.
Failure to consider timely updates for the information displayed
Inaccurate information makes it difficult for users to engage with the performance dashboard. Consider automating updates for accuracy and timeliness.
Failure to consider user personalization
Each user has their own way of looking at information. Consider providing options for personalization.
How Performance Dashboards Improve Productivity
A performance metrics dashboard can be considered a bridge connecting day-to-day activities and results, thereby providing a means to continually enhance productivity.
Real-time tracking of employee performance
Track the number of tasks completed, time taken on projects, and progress made towards goals. This could result in faster feedback loops as performance improves.
Bottleneck detection in workflows
Detect potential bottlenecks in different departments before productivity is affected.
Better time management
A dashboard can help identify where time is being wasted and where productivity can be increased.
Aligning team efforts with goals
Everyone in the team can be aligned toward goals using shared visibility of performance metrics.
Time tracking + performance insights
When integrated with time tracking software like Tivazo, dashboards can provide insights into productivity, enabling teams to see not just what is being done but also how it is being done.
Tools & Software for Creating Performance Dashboards
Choosing the right performance dashboard software depends on business size, budget, and technical skill.
- Business intelligence platforms: Advanced analytics and handling large data with tools such as Tableau, Power BI, and Looker.
- Productivity performance tools: Pre-built dashboards for employee performance.
- Time tracking platforms: Real-time time tracking with performance reporting for maximum productivity.
- Spreadsheet dashboards: Excel, Google Sheets, and other spreadsheet tools can be used for simple dashboards for those with limited budgets.
- How to select the best tool: The best software can be chosen by considering the ease of use, integration, and the need for real-time reporting.
Conclusion
It is now a must-have for any business to be competitive in the year 2026 and beyond, and the only way to do this is by utilizing a performance dashboard. It is a powerful way to convert complex data into simple, real-time information to make better decisions.
The best way to go about it is to start simple, focusing on a few vital statistics, keeping the information simple, and ensuring the data is updated regularly. As one becomes more comfortable with the process, more complex data can be added to the dashboard.
Real-time performance monitoring is no longer a luxury, it is a necessity. It is essential for any business to be able to identify trends, solve problems, and capitalize on opportunities quickly, and those who do will always be ahead of those who do not.
Creating a performance dashboard is the best way to set up any business for success, growth, and productivity.