Managing a team without tracking productivity is like driving blindfolded. You might move forward, but you won’t know if you’re heading in the right direction.
Productivity reporting helps you see what’s working and what isn’t. It gives you real numbers to make better decisions. Without these reports, you’re relying on gut feelings and assumptions that might be completely wrong.
Many managers avoid reporting because they think it’s complicated or time-consuming. The truth is, modern performance measurement tools have made the process much simpler.
This guide will show you how to create useful reports that actually help your team perform better. You’ll learn which metrics matter most, how to collect data efficiently, and how to turn numbers into actions.
What is Productivity Reporting?
Productivity reporting is the process of measuring and documenting how much work your team completes. It tracks time, tasks, and results in a clear format that anyone can understand.
Productivity reporting measures how effectively your team completes work over time. It transforms daily activities into clear data that reveals patterns, problems, and opportunities for improvement.
Productivity reporting helps you understand how your team has spent their time. These reports will show patterns that can alert you to problems before they become serious issues.
Performance measurement tools can make it easier to measure productivity reporting. These tools can automatically gather data and create reports that can be viewed at any time.
Why It Matters
- Good reports help managers make smart choices about resources
- They show which projects need more support and which ones are running smoothly
- KPI dashboards display this information in charts and graphs
- This makes complex data easy to understand at a glance, even for people who aren’t numbers-focused
- Reports create accountability across the entire organization
- When performance is visible, people naturally stay more focused on results
Key Productivity Metrics to Track
Choosing the right metrics separates useful reports from meaningless number collections. The best productivity metrics directly connect to your team’s goals and help you make specific decisions about how to improve.
Essential Productivity Metrics
- Output per hour: How much work gets done in a specific time period
- Task completion rate: Percentage of assigned tasks finished on time
- Utilization rate: How much of the available work time is spent on productive tasks
- Quality scores: Accuracy and standards met in completed work
- Response time: How quickly team members address requests or tickets
- Cycle time: How long it takes to complete a task from start to finish
Employee productivity tracking tools capture these numbers automatically. This saves time and reduces errors from manual counting or estimation.
Team productivity analysis looks at patterns across all these metrics. You might notice that certain times of day show higher output per hour.
Choosing Your KPIs
- Every team is different. A sales team might track calls per day, while developers track code commits or bug fixes completed.
- Pick three to five KPIs that match your team’s main goals. Too many metrics create confusion instead of clarity.
- Your chosen metrics should connect directly to business results. If a number doesn’t help you make decisions, don’t track it.
Steps to Create a Productivity Report
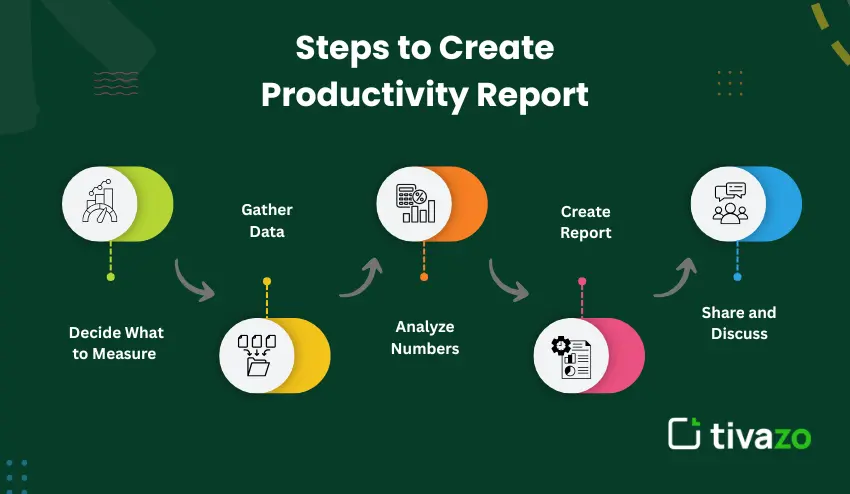
Creating your first productivity report is not as daunting as you might think when you break it down into steps. Each step has a particular purpose that all adds up to give you a comprehensive view of your team’s productivity.
Step 1: Decide What to Measure
First, you need to determine what you want to find out. Do you want to find out who is overwhelmed? Are some projects taking longer than they should to finish?
Your questions will help determine what data to include in your report. Write down your questions before you start gathering your data to help you stay focused on what you need to find out.
Step 2: Gather Your Data
- Using timesheets to track how long it takes to complete different tasks
- Connecting to project management software to view task completion rates
- Using customer service software to view response time
- Using quality control software to view accuracy
Performance management software connects to multiple sources of data. This provides you with a comprehensive view of your data without having to use multiple pieces of software and copy and paste data.
Step 3: Analyze the Numbers
Analyze the numbers for trends over a series of weeks or months, not days. One bad day does not mean there is a problem. Three bad weeks, however, may mean something is amiss.
Productivity dashboards help you compare the numbers. It is easier to recognize trends when you see the numbers represented graphically rather than as raw data.
Step 4: Create the Report
Make the report simple and to the point. Only include the most important data on the first page. This is where the busiest managers will look.
Use charts for the big picture trends. Use detailed tables only if absolutely necessary. These tables are best left for the appendix.
Include a summary at the top of the report. Busy managers want to get the gist of the report in 30 seconds or less.
Step 5: Share and Discuss
Send the report to the managers of the teams, the HR analytics group, and the operations managers. These groups will want the data for different reasons. Consider making different versions of the report.
Schedule a meeting to discuss the report. A report is more useful when you can ask questions and discuss the data.
Best Practices in Employee Productivity Reporting
Trust-building and performance improvement are the hallmarks of good employee productivity reporting. It’s not just the data that matters but how you gather, interpret, and present it.
Keep It Fair and Accurate
Do not record data that has not been collected. Never estimate or guess at figures. Poor data produces poor decisions, which negatively affect everyone.
Ensure that everyone understands what is being measured and why. Unexpected monitoring will quickly undermine trust and make people feel they are being spied on rather than helped.
Make Reports Actionable
- Each report should point to specific actions
- Identify areas that your team can control
- Point out problems and successes
- Link metrics to business results
Operations managers require different information from team managers. Reports should be tailored to meet the needs of each group, rather than sending out the same generic report to everyone.
Report Regularly
Weekly reports are suitable for most teams. They are frequent enough to detect problems early but not so frequent as to be annoyingly noisy.
Monthly reports provide a clearer view of trends. They filter out the random highs and lows of a given week to reveal true trends.
Protect Privacy
Employee performance data should remain private between each worker and their direct supervisor. Teamwide rankings foster unhealthy competition rather than teamwork and harm morale.
Team reporting should emphasize group data and overall progress. Personal feedback should remain private and occur on an individual basis.
| Frequency | Best For | Example Use |
| Daily | Customer service, production floors | Track ticket close rates and point to bottlenecks |
| Weekly | Project teams, development | Sprint progress and blockers in real-time |
| Monthly | Department-wide analysis | Utilization rate and capacity planning |
| Quarterly | Executive reporting | Goal accomplishment and ROI on strategic projects |
Top Productivity Reporting Tools
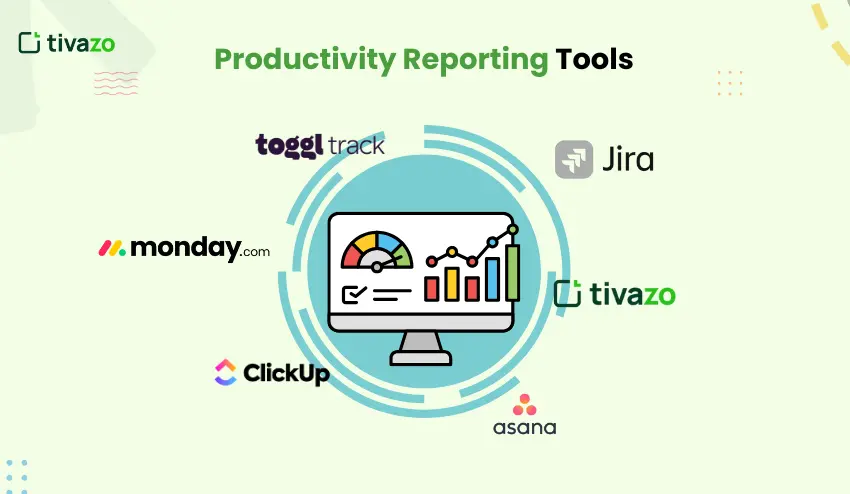
The right productivity reporting tool can automate reporting tasks that would normally take you hours to do manually, giving you minutes of productivity instead. Today’s productivity reporting tools integrate with your existing systems, updating themselves automatically, so you can get back to work instead of monitoring how much work you’re doing.
Productivity Dashboard Tools
These types of productivity dashboard tools integrate with your existing work systems, automatically importing data from project management, time management, and communication programs you already use.
Most productivity reporting tools update themselves in real time, so you don’t have to wait to see current numbers or wait until the end of the week to see how much work you’re getting done.
Performance Management Software
A full performance management software solution would include reporting, goal setting, and review functionality. This is a larger investment, but it will address more requirements in one solution.
They are great for HR analytics teams that need to monitor several departments. Everyone can use the same software, but with different views and levels of access.
Examples to Consider
- Tivazo: Tivazo is a full solution for time management and productivity with real-time reporting, performance analysis, and in-depth reporting. Offers a free plan for up to 10 members and advanced features for $3 per member per month
- Asana: Project management with built-in reporting on task completion rates and team workload
- Toggl Track: Time management with a focus on utilization rate and billable hours for agencies
- Monday.com: Visual reporting dashboards that automatically update as work is completed, with customizable views
- ClickUp: Full project management software with in-depth productivity analysis
- Jira: Development project management software with sprint reporting and velocity analysis
Choosing Your Tool
For small teams with fewer than 20 members, basic project management software will suffice. It will include sufficient reporting functionality for most requirements without becoming too complicated.
For larger teams, more advanced performance management software is required. This should include functionality to manage multiple projects and departments with different workflows.
Benefits of Regular Productivity Reporting
Tracking helps teams work together and make decisions in a more efficient manner. It provides a better understanding than gut feelings and assumptions alone can achieve.
Better Decision Making
Data takes the guesswork out of planning. We know exactly how long a task takes, not how long we wish it took.
This helps with staffing decisions as well. If everyone’s utilization rates are high, we may need to hire rather than just shifting work around.
Increased Accountability
When everyone can see how work is progressing, everyone stays focused. Productivity reporting helps teams work together in a way that’s motivating rather than pressuring.
- Team members will recognize their own slowdowns sooner
- Managers can assist struggling team members sooner
- Everyone will understand how their work affects the entire team’s goals
- Everyone will understand how to recognize and reward their peers correctly
Smarter Resource Use
Reports show you which tasks use the most time. There are ways to speed them up or even automate them, leaving you with more time to focus on other, perhaps more important, tasks.
This helps the operations manager in task assignment among teams. Everyone is kept busy without feeling overwhelmed and burnt out.
Common Challenges and How to Overcome Them
Even the best-designed reporting systems face challenges that can render them ineffective. It is essential to be aware of these challenges before they occur to ensure that you incorporate solutions into your process from the beginning.
Challenge: Inaccurate Data
Data is not tracked or is entered late. This renders your data inaccurate and your decisions suspect.
Solution: Select performance measurement tools that make it simple to track. The simpler it is, the more likely people will actually do it.
Challenge: Too Much Information
Some teams track too much and then are overwhelmed by the data. Reports are 20 pages long, and no one reads them.
Solution: Begin with three essential metrics and expand only if necessary. Your productivity report should be viewed on one screen without scrolling.
Challenge: Reporting Takes Too Long
Manual reporting is a time-consuming process, taking up many hours every week. The irony is that monitoring productivity actually hurts productivity.
Solution: Automate the process by using employee productivity tracking software. The software should be able to collect data while employees are working normally.
Challenge: No One Acts on Reports
Everyone produces beautiful reports, but no one does anything about them. The numbers are useless because nothing changes.
Solution: Add action items to the end of the report. What changes need to be made based on this data?
Conclusion
Productivity reporting helps turn guesswork into knowledge. Instead of wondering how your team is doing, you’ll know exactly how they’re doing.
The best reports are those that are simple, regular, and honest. They should give you the numbers you need to make better decisions about your team, processes, and priorities.
Start with a few key productivity reports. As you learn what information is most useful and what information is simply noise, you can add more tracking.
Productivity reporting tools and dashboards should suit your team’s needs. A good tool should make reporting easy, not painful.
Don’t forget that employee productivity reporting should help your team, not hurt them. Use data to support your team, not simply judge them.