According to Marketing LTB, 64% of marketing leaders strongly agree that data-driven marketing plays a critical role today.
Audiences, creatives, conversions, attribution – everything is measured, optimized, and fine-tuned.
But most of that focus stays outward.
Inside the team, another powerful layer of signals often goes unnoticed.
Not just what performs, but how the work actually gets done.
What if time tracking could tell you as much about marketing performance as your dashboards do?
Curious? Let’s take a closer look.
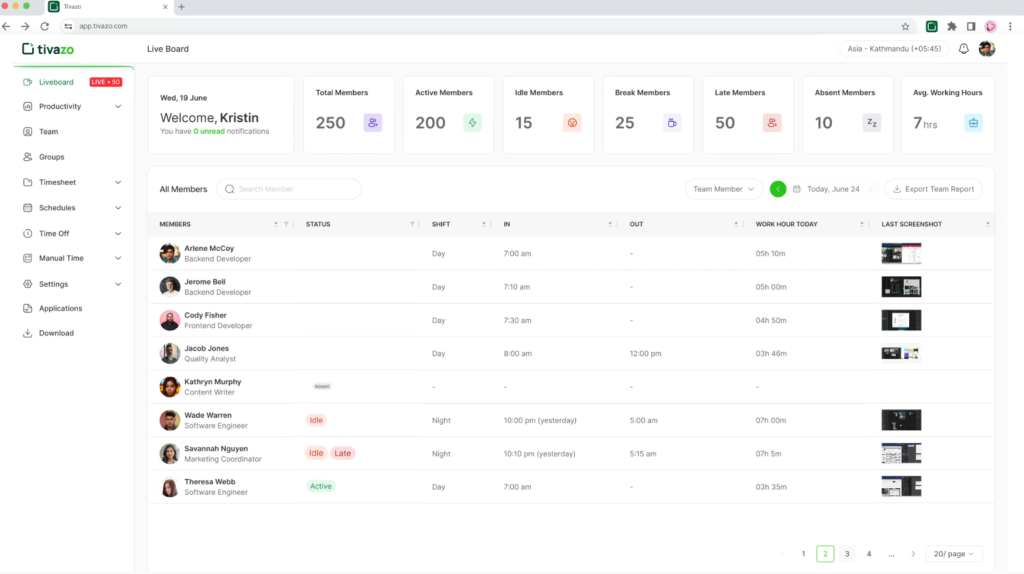
P.S.Want to see this in action right away? Tivazo turns time logs into clear, actionable insights in just a few clicks. Try for free now!
The Hidden Power of Time Logs in Marketing Teams
Time logs are records of how teams allocate their working hours across tasks and projects.
Traditionally, they’ve been treated as a mechanical routine: start the timer, stop the timer, maybe tag the task, then move on.
The blind spot for most companies is that time data sits in a drawer or spreadsheet and never gets looked at strategically.
Yet research suggests that high-performing teams approach this data very differently.
Keevee indicates that up to 87% of them actively use time-tracking tools like Tivazo, while 90% of businesses report improved accountability once hours are logged consistently.
Moreover, making work visible through time tracking has been shown to boost productivity data by around 30%.
Together, these numbers point to a clear conclusion: time logs are an underused source of insight.
So how do you move from just tracking time to actually learning from it?
From Logging Hours to Discovering What Truly Works
At some point, every marketing team hits the same wall.
Everyone feels busy, deadlines keep moving, and results stay uneven.
Imagine a team that spends roughly 20% more time producing video content than writing blog posts.
Video feels more exciting, more modern, more visible. But when performance data enters the picture, the surprise hits.
Blogs bring more qualified leads, longer engagement, and stronger conversions.
When time spent connects directly to outcomes, patterns become obvious.
Pro tip: If you want a clear line between effort and outcomes, Tivazo turns raw time data into detailed productivity data insights that reveal patterns and blockers in how work actually gets done.
Effort Does not Always Equal Impact
Look closely, and raw time logs data reveals patterns you can act on:
- How much effort campaigns need versus the return you’re getting.
- Where content creation hits delays and slows everybody down.
- Where having work done in-house makes sense, or outsourcing may be smarter.
Teams can cut wasted hours, double down on what actually works, and stop guessing during planning meetings.
At this stage, the data speaks. You just need to know how to read it:
What Your Time Data Knows About Your Marketing (That Dashboards Don’t)
Time logs become strategic only when you know what to pay attention to.
Here are the key patterns every marketing team should recognize:
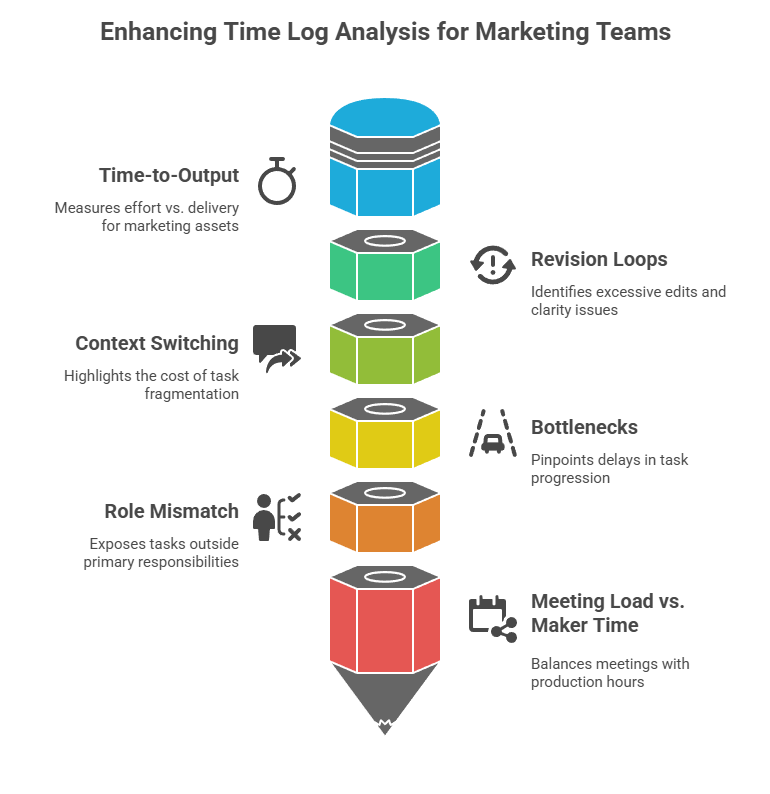
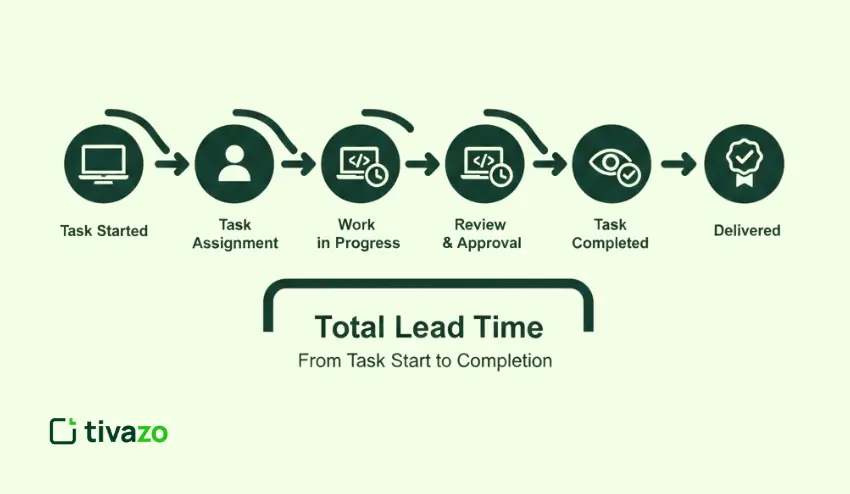
Time-to-output
This metric focuses on the relationship between effort and delivery.
It tracks how much work goes into producing a single marketing asset, from the first brief to the final version.
Because nearly two-thirds of marketers( 66.5%) report challenges with resource allocation, understanding time-to-output becomes even more essential.
When reviewed consistently, it highlights where production slows down, where expectations may be misaligned, and where planning assumptions need adjustment.
Revision Loops
Too many rounds of edits? That’s a red flag.
Whether they come from creative, legal, or a stakeholder who “just had one more thought,” tracking revisions shows where things get stuck.
It also reveals where briefs may lack clarity or where decision-making is too slow.
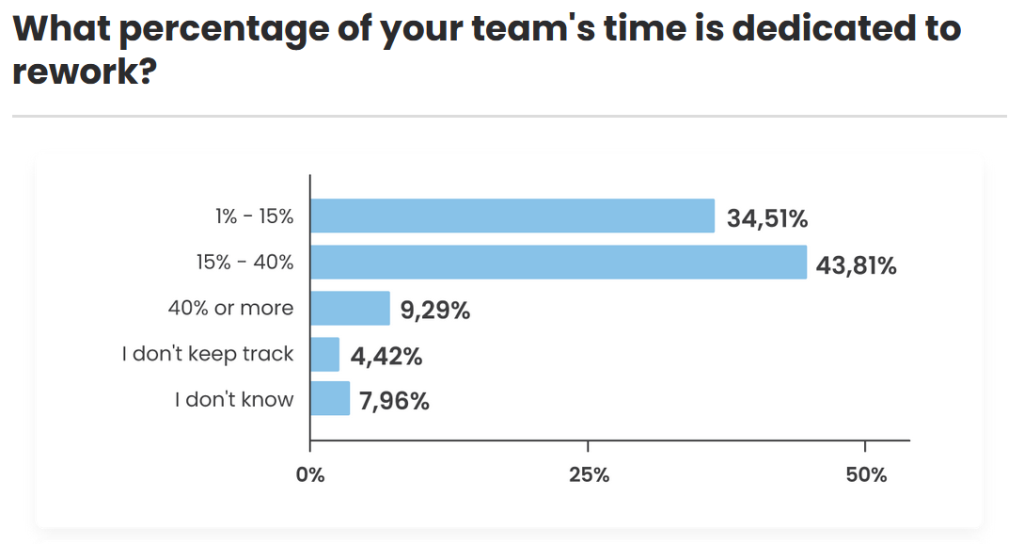
And the cost isn’t trivial: many agencies estimate that 15-40% of team time logs is spent on rework, often driven by unclear direction or fragmented feedback.
Context Switching
Jumping between tasks feels productive, but it comes at a cost.
After an interruption, it takes people about 23 minutes on average to fully regain focus on the original task.
Moreover, when time logs show high fragmentation (five half-hour blocks instead of one focused stretch) it usually signals burnout, stress, and shallow work.
Reducing this improves depth and output quality.
Bottlenecks
Every team has them.
Briefs that sit untouched, approval cycles that drag, design tasks piling up, or dev queues slowing launch.
In fact, employees often spend over 25% of their day just looking for the information they need to move a task forward.
Time logs highlight where tasks wait the longest. Those delays kill momentum and eat into creative time.
Role Mismatch
Studies show that team members can spend up to 51% of their workday on tasks that don’t contribute to their primary roles, often without leadership realizing it
When senior team members spend hours resizing images or updating spreadsheets, that’s a mismatch.
The same goes for specialists handling admin.
Time logs expose these patterns so you can reassign, delegate, or automate, freeing up your top talent for high-impact work.
Meeting Load vs. Maker Time
Too many meetings? Classic.
They’re part of the job, but when they consistently outnumber production hours, it’s a problem.
Surprisingly, 83% of employees spend up to one-third of their workweek in meetings, leaving far less time for uninterrupted, high-value output.
Tracking meeting-to-creation ratios by team or project helps rebalance schedules and protect deep focus time.
Once you know what to watch, the next step is turning insight into a single guiding metric.
The “Impact per Hour” Metric (your north-star KPI)
This idea sits in one simple formula:
Impact per Hour = outcome ÷ time spent.
If a campaign brings 40 qualified leads from 10 hours of work, your Impact per Hour equals 40 ÷ 10 = 4.
Another campaign that takes 25 hours for the same 40 leads has an Impact per Hour of 40 ÷ 25 = 1.6.
Feels different, right? Same outcome, very contrasting use of energy and resources.
Where to Apply It
Use this metric by category:
- Content Types: Which formats bring the most return per hour spent? You’ll often find unexpected winners hiding behind low-lift assets.
- Campaign Stages: Break it into research, production, distribution, and optimization. One might soak up all the time while another drives results.
- Roles: Writers, designers, strategists, media buyers – see where each skill drives outsized impact or gets pulled into low-leverage tasks.
Heads up: This metric helps prioritize, not pressure. Always pair it with a clear quality bar.
Decision Grid
This simple chart helps you stop arguing over gut feelings and start making decisions backed by actual output data:
| High Time | Low Time | |
| High Impact | Optimize and scale | Prioritize and protect |
| Low Impact | Cut or rethink | Automate or templatize |
And this is where insight starts shaping real marketing choices.
How to Turn Time Data Into Marketing Decisions
Once time logs reveal patterns and your Impact per Hour metric is set, it’s time to turn those signals into smart moves across your team.
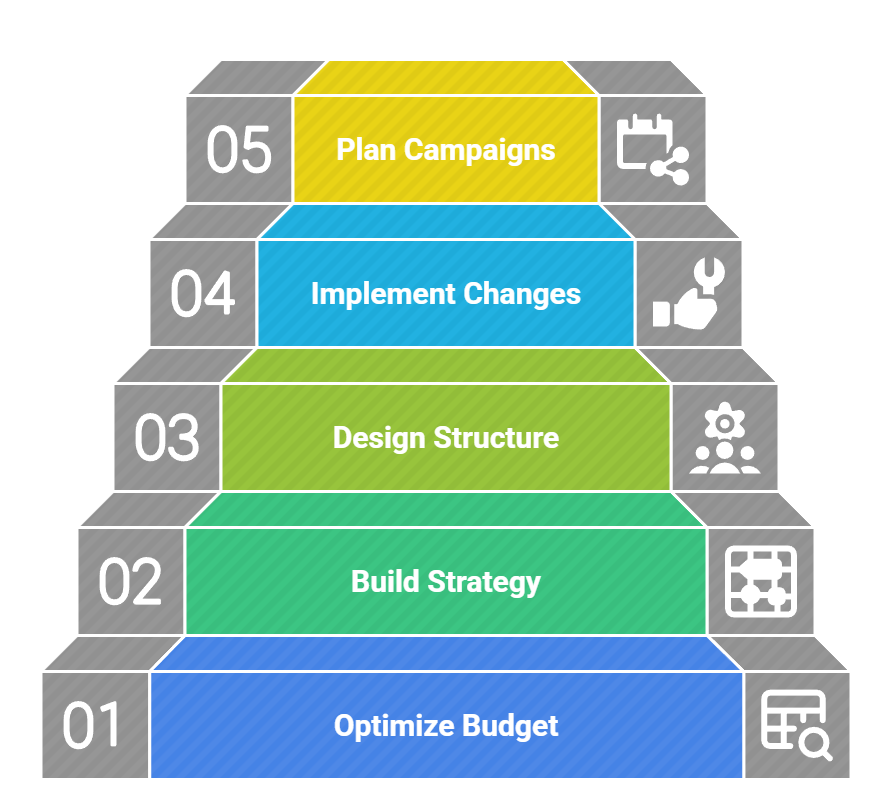
Optimize Your Budget Allocation
When a channel, campaign, or asset consistently delivers higher impact per hour, it deserves more budget, better tools, or additional support.
On the other hand, low-impact time highlights where spending discipline makes sense.
This approach keeps budgets tied to performance rather than habit.
And that tie pays off, since organizations that align budget allocation with strategic performance KPIs report up to 42% higher marketing ROI.
Build a High-Impact Channel Strategy
As we mentioned before, different formats consume time at very different rates.
Time data reveals which channels reward effort and which ones drain it.
This allows you to rebalance content types based on real contribution per hour, scale what works, and reduce focus on formats that look exciting yet deliver weaker results.
At the same time, it’s risky to double down on just one “hero” channel.
Multi-channel campaigns can still deliver up to 166% higher engagement.
Design a Scalable Team Structure
Begin by tagging time logs by role and task type, then highlight tasks that drain senior time, like admin, formatting, and basic reporting.
Next, move those tasks to a coordinator, junior role, or automation owner, so specialists stay in high-impact work.
Then decide whether to outsource or hire using a simple rule: recurring workload goes to hiring, spike workload goes to outsourcing.
Pro tip: 78% of companies see ROI gains within six months of outsourcing marketing, and it’s usually a focus problem being solved, not a budget one. Specialized agencies, such as inBeat, are often brought in to absorb that execution load.
Implement High-Leverage Process Changes
Pick one bottleneck from the logs, and focus only on that for one sprint.
Then set one rule that reduces friction, such as a single decision owner, a two-round feedback limit, or a ready-to-start brief template.
Poor communication contributes to the failure of 70% of projects, and bottlenecks like unclear decision ownership or slow review cycles are often the hidden cause.
In parallel, measure cycle time before and after the change so you see real improvement.
If the cycle time drops, lock the change into an SOP and move to the next bottleneck.
Plan Campaigns That Drive Measurable Results
Deadlines that land on vibes alone usually slide.
Only about 2.5% of companies actually complete all their projects on time, which means almost everyone is operating with timelines that don’t match reality.
But if you track how long each stage of the process takes, you can build timelines grounded in real production speed.
Remember: Better planning = smoother launches, cleaner execution, and less burnout.
That only happens when you forecast based on your team’s truth, not fantasy.
Now that you know how to use the data, you need to avoid the mistakes that weaken it:
Common Pitfalls That Undermine the Value of Time Tracking
1. One common myth says time tracking kills creativity
But in reality, teams track processes, not people. Instead of control, the focus remains on visibility into workflows, friction points, and effort distribution, which allows creative freedom to stay intact.
2. Another challenge often arises from weak tagging
When labels differ by person or even by mood, insights quickly lose clarity. By contrast, clear and shared tags produce clean data that supports meaningful decisions.
3. Vanity productivity also sneaks in easily
Saving hours feels good, yet performance drops when teams chase speed instead of outcomes. For this reason, time data works best when paired with results, not efficiency alone.
4. Over-attribution creates confusion as well
Time logs add context to dashboards, while performance data still carries weight. Together, they tell the full story.
5. Finally, trust matters
Teams need clear rules, transparency, and shared purpose. When people understand how data supports smarter work, adoption follows naturally.
Step-by-Step Implementation Guide to Using Time Data Effectively
The ideas above may seem layered, so we broke everything into a practical sequence you can use right away.
| Phase | What you do | What do you look for | What you change |
| Start clean | Set 8 core categories, and one shared tagging rule for everyone | Missing tags, vague labels, and random personal systems | One tag dictionary and one owner for updates |
| Capture reality | Track for 14 to 28 days across real projects | Time fragmentation, long waits, heavy meetings | Protect two focus blocks per day per maker role |
| Read the patterns | Pull three views: time-to-output, revision loops, bottlenecks | Slow assets, repeat edits, queues that trap work | One brief template and one approval path per asset |
| Add outcomes | Match each campaign to one outcome metric and calculate Impact per Hour | High effort with weak lift, low effort with strong lift | Shift time toward winners and reduce low lift work |
| Decide weekly | Hold a 30-minute review with three questions: expensive, effective, stalled | Drift in priorities, hidden rework, overload | One decision per week, tracked in a simple log |
| Scale safely | Set a quality threshold and track it beside speed | Fast output with weaker performance signals | Keep quality gates, then optimize speed after |
Final Take: Time as Your Sharpest Insight
Time logs are more than admin. They are internal performance analytics.
Every hour logged is a signal: about how your team works, where energy flows, and what actually moves the needle.
Let’s recap the key shifts:
- Effort ≠ impact
- Time data reveals hidden constraints
- You optimize systems, not people
- Impact per Hour becomes your alignment metric
When tracked with intent and paired with outcomes, time becomes your most honest dataset.
You stop guessing, stop over-committing, and start designing marketing systems that actually scale.
Want to put this into practice?
Run your first time tracking sprint with Tivazo, connect it to real results, and review your baseline.
The insights are already there; you just need to look.