Are you seeing busyness, not productivity, from your employees? If your team is generating long hours, sending too many emails, and is in meetings from sunup to sundown, yet they are still clinically unable to produce high-quality work that provides a strategic advantage, you are probably stuck in the Productivity Illusion. This illusion is being perpetuated by outdated Activity Metrics that measure motion (clicks, time logged), instead of impact. For knowledge workers, busyness trumps deep work and is guaranteed to lead to mediocrity, fatigue, and burnout.
In this blog post, you will find your all-in-one toolkit to be set free from the realm of “shallow work” and develop a management methodology around Focus Metrics. We will explore why measuring inputs is not helping your team’s performance, and help you to start measuring the one resource that impacts innovation – the resource of focus: Uninterrupted Deep Work Time.
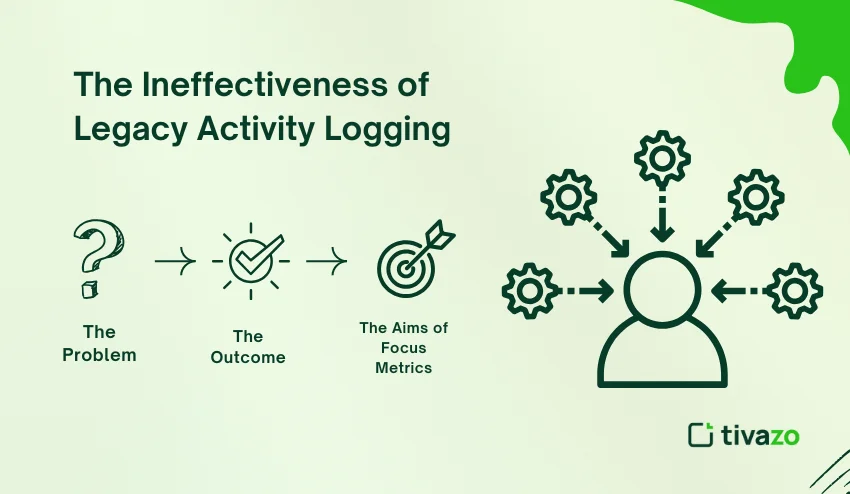
The Ineffectiveness of Legacy Activity Logging
- The Problem: Legacy tools capture input (emails sent, keyboard activity, and hours logged).
- The Outcome: Employees ‘game’ the system, create burnout, create high context switching, and ultimately create surface work without any depth or strategic value.
- The Aims of Focus Metrics: Measure output/focus (streaks of uninterrupted work, time in core applications, deep work ratio) so we can identify and remediate systemic blockers to output.
The Core Distinction: Activity Metrics vs. Focus Metrics
The very first and perhaps most important step in improving your team’s performance is to begin to understand the difference between the noise of activity and the signal of focus.
What Are Activity Metrics? (The “Shallow Work” Trap)
Activity Metrics are quantitative metrics of employee activity; they are the gauges on a dashboard that reflect motion. Examples would be the number of calls, the number of files opened, and the number of messages sent.
- The Ideal Scenario: High volume, repeatable roles where volume is directly correlated with success (for example, the number of calls per hour accounts for success in a call center representative role).
- The Trap: For knowledge workers, engineers, writers, and strategists, Activity Metrics are distractions. They measure volume, not value. A software engineer could log 8 hours of “active time” on employee messaging apps (for example, Slack) to communicate and catch up on emails, and have not a single commit of code. This is the definition of shallow work.
Understanding the Power of Focus Metrics and Deep Work
Focus Metrics are measures designed for you to quantify the duration, quality, and effectiveness of your most challenging cognitive work time, referred to as Deep Work, according to Cal Newport’s definition. Deep work refers to the ability to focus without distraction on a cognitively demanding task.
- Main Idea/Principle: Spending time in a flow state (deep work) creates exponentially greater value and innovation than the mixed and shallow work state. Focus Metric measures your success in accessing and sustaining that flow state.
- Main Idea/Takeaway: By measuring the conditions and stop-start streaks of focus, you’ll know what the most significant distractors/blockers of productivity are (e.g., too many meetings and chat alerts) that can influence the focused attention environment. This data moves management away from “watching” to being a coach to create systemic improvement.
The Focus Metric Framework for Teams to Achieve High Performance – Three Pillar Framework
To use a Focus Metrics system, we need to capture three categories of data that show what the working style of a team really looks like. These metrics provide a solid foundation for the diagnosis of where bottlenecks are and can guide effective coaching toward excellence.
1. Deep Work Integrity (measuring flow state)
This pillar measures how well individuals (and teams) protect their most precious time for work so that they can maximally focus and work in a state of flow, which is the heart of productivity.
- Uninterrupted Time Streak (UTS): The most critical Focus Metric. This is the average length of time (in minutes) an employee engages in a high-focus application without any measure of interruption (e.g., a meeting, a chat message that was not urgent, or switching to an email).
- Benchmark: High-performing knowledge teams strive for an average UTS of 75 – 90 minutes.
- Deep Work Ratio (DWR): The amount of the workday dedicated to work time that is focused work, calculated as follows:
Total Working Hours / Total Uninterrupted Focus time.
- Focus App Utilization: The percentage of DWR time utilized in applications closely aligned with a core project delivery (e.g., IDEs for developers, modeling software for analysts, writing applications for writers) is another strong indicator of intentionally focused work.
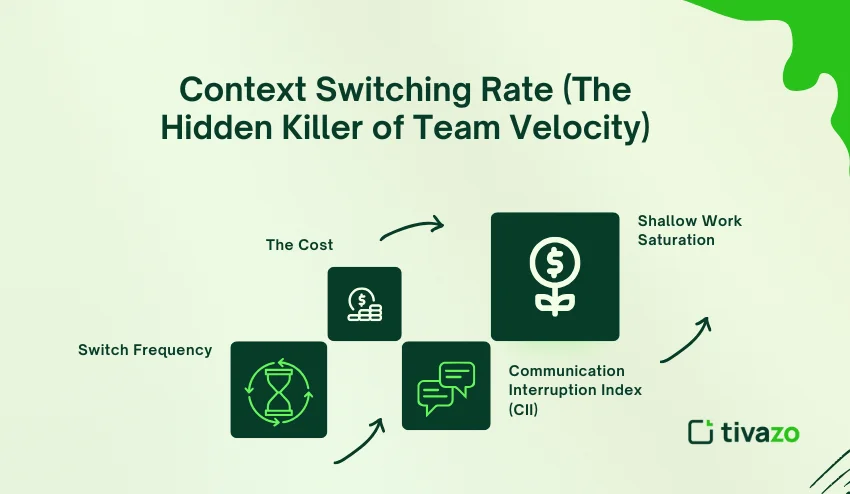
2. Context Switching Rate (The Hidden Killer of Team Velocity)
The concept of context switching – the rapid jump between unrelated tasks – poses the largest hidden cognitive cost in today’s workplace. Studies suggest it can cost a team up to 40% of productive time due to “thinking residue.” The purpose of this pillar is to measure both the frequency and severity of this cognitive cost.
1. Switch Frequency
The average number of times an employee switches between major project categories or unrelated application categories is hourly. A drop from ten switches to four switches can change everything!
2. The Cost
Research states that it takes an average of approximately 23 minutes and 15 seconds to fully regain concentration after a major interruption. Time spent multitasking is your Switch Frequency multiplied by your lost time.
3. Communication Interruption Index (CII)
The ratio of inbound communication (essentially emails and chat messages) to productive time is the Communication Interruption Index (CII). A higher CII (e.g., 10 messages to 1 hour of focus) equates to a reactive, notification-driven culture that has a high probability of blocking the organization from deep work.
4. Shallow Work Saturation
The total percentage of the workday spent on low-cognitive demand work: non-essential, internal emails (especially those of reasonable length), administrative logging, or meeting minutes, unscheduled, or non-agenda meeting time. If your team is working at a shallow work saturation above 50%, they will always underperform.
Outcome-Oriented Productivity (Connecting Focus to Outcomes)
At the end of the day, focus metrics must equate to output. This aspect expands on your Focus Metrics and is linked to the business outcomes that you have controlled through your Focus metrics; thus connecting effort with impact.
- Focus-to-Deliverable Ratio (FDR): The ratio of Deep Work Hours that you invested in a project to your final delivery/completion time. This is a great metric for project management and allocating resources. For instance, if a task required 10 total hours and only 3 Deep Work efforts (a 3:10 FDR), then your other 7 hours were wasted due to shallow work. A team with a 1:2 FDR is highly efficient.
- Sustainment Score (Quality Metric): The overall percentage of feature, content, or project work that will require a lot of rework or churn (re-open a ticket, rewrite content) within a 30-day window. The higher focus equates to a lower error rate and increased focus metrics.
- Lead Time with Deep Work Annotation: You will track the overall time from a task being picked up until it is completed (Lead Time), but also annotate it with the total DrW on the task. This measurement is evidence that tells you that when you invest more time doing Deep Work, it greatly reduces the overall Lead Time. This is validation for your entire framework.
Implementing Focus Metrics while avoiding a culture of surveillance
The most significant challenge for the use of Focus Metrics is the fear of micro-management and being surveilled. The successful transition will require a change from monitoring to coaching. Focus Metrics are to be employed as a diagnostic tool for the system and not a weapon of discipline for the individual.
The Transparency Mandate: Establish a Trust Framework
- Anonymize the Team View: Leaders should only be looking at team trends (e.g., “Our Context Switching Rate jumped by 15% this week due to an increase in all-hands meeting schedules”) and not individual-level data. The data is intended to diagnose systemic process issues.
- Self-serving of the Data: The primary consumer of the data is largely intended for employees themselves. Tools should be used to empower employees to look at their own Focus Metrics to observe their own distractions and work to improve on their own. Use the data to promote their autonomy.
- Explain dislike and ‘why‘: Explain to employees that the focus metrics are there to protect their time and increase their most precious asset: cognitive bandwidth. The frame is to maximize the collective environment for everyone.
Practical Strategies for Managers and Leaders
- “Maker’s Schedule” Protection: Take on Cal Newport’s idea and mandate a time block each week for “Deep Work Only” – no company internal meetings or non-urgent chit chat! Use your Uninterrupted Time Streak data to hold this time/space and measure how effective this break is in an effort to preserve the time and space.
- Metric-Driven Coaching: Replace accusatory questions with diagnostic questions. Instead of, “Why did you complete only 3 tasks?” try, “Your Uninterrupted Time Streak has dipped down to 45 minutes over the past week. What was the largest systemic blocker (Was there a team meeting, communication protocol, system breakdown) that we, as managers, need to fix?”
- Optimizing the Meeting Calendar: Use your Shallow Work Saturation data to identify “meeting-overload” days. If the DWR reported by your team for Monday is only 20% because of the number of meetings on Monday, then Monday would help reset and rebalance the work week, and you begin to use the metric to start affecting process change.
Measuring effort in action: Coaching versus policing
| Metric | Before Focus Metrics | After Implementation (6 months) | Improvement |
| Average Uninterrupted Streak (UTS) | 22 minute | 78 minutes | +255% |
| Context Switching Rate (per hour) | 12.5 switches | 4.1 switches | -67% |
| Error Rate in Client Projects (Sustainment Score) | 11% | 2% | -82% |
| Employee Self-Reported Burnout | High (4.1/5) | Low (1.8/5) | Significant |
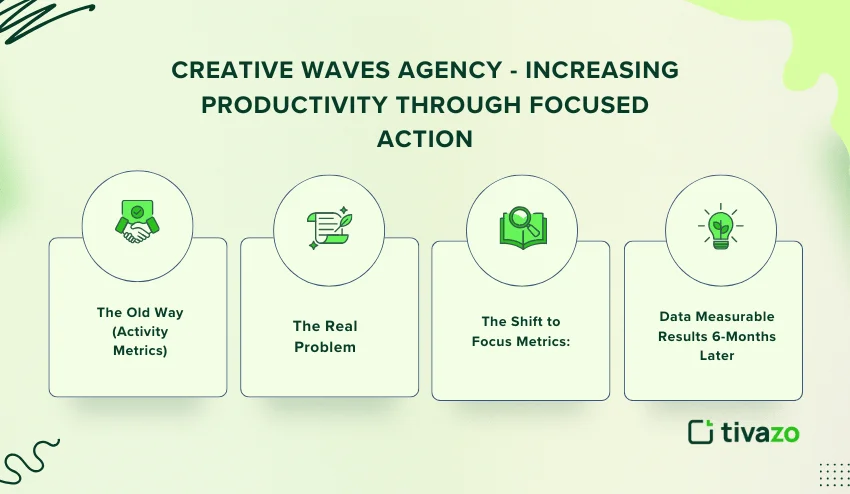
Creative Waves Agency – Increasing Productivity Through Focused Action
Let us examine how a mid-sized remote marketing agency, named Creative Waves, went through this transition, changing a culture from “always-on” anxiety to high-output flow.
- The Old Way (Activity Metrics): They measured time logged and the number of tasks completed. Employees were keeping an email or chat open just to log “active time”. This happened with constant context switching and fragmented attention.
- The Real Problem: Internally, they reported a high “Active Time” percentage of 95%, but they also reported the “Client Satisfaction” (CSAT) percentage was ismally low because of errors, quality implications, and missed deadlines. They had an average Uninterrupted Time Streak of 22 minutes. They were busy, but they were not productive.
- The Shift to Focus Metrics: Creative Waves changed to tracking time spent in their core creative tools (Adobe Suite, CMS) and penalized context switching in initiated scheduled Deep Work Windows. Management agreed to a commitment to reduce mandatory weekly meetings by 30%.
- Data Measurable Results 6-Months Later: They shifted their entire operation by focusing on the quality of attention – the Focus Metrics – creating positive results
Conclusion
In the years ahead, the most successful companies will be those that understand that the real currency of knowledge work is focused attention. Surveillance is a relic of the industrial age, when knowledge workers are effectively machinery, measuring movement instead of impact.
Focus Metrics represent an “*important* paradigm shift” – they measure the conditions for producing high-quality work, and they essentially engender trust, autonomy, and greater contribution in a meaningful working environment. When we shift from the complexity of measuring “activity” understanding the only signals of actual focused engagement, the leader is unlocking the real potential of their team – every logged minute is a minute of engagement, of verifiable, quantifiable value.
It is time to stop measuring existence (busy-ness) and begin measuring and valuing focused time and “deep work”. Start using Focus Metrics today: redirect your team’s engagement and performance from existing in fragmented chaos to working in deeper flow.