Response time gets more airtime in ecom support meetings than any other metric, and it explains the least about whether a team is actually working. 64% of shoppers expect a reply within 1 hour, and 74% want 24/7 coverage.
But neither stat tells you if those replies fixed anything or whether your agents will still be around next quarter.
This post walks through 7 ecom customer support KPIs that predict revenue, retention, and team sustainability, and pairs them with the agent productivity tracking signals most dashboards miss.
What Ecom Customer Support KPIs Actually Measure (& Why Response Time Alone Falls Short)
Ecom customer support KPIs are the specific, measurable signals that tell you whether your support team is resolving customer problems, protecting revenue, and running at a pace that’s sustainable. Response time is one of them. Calling it the only one is like judging a restaurant on how fast the waiter takes your order.
The support function inside a DTC or multi-channel ecom brand does more than close tickets. It recovers abandoned revenue through pre-purchase conversations, protects margin through return reduction, catches product defects before they turn into refund waves, and feeds marketing with the exact language customers use to describe pain points.
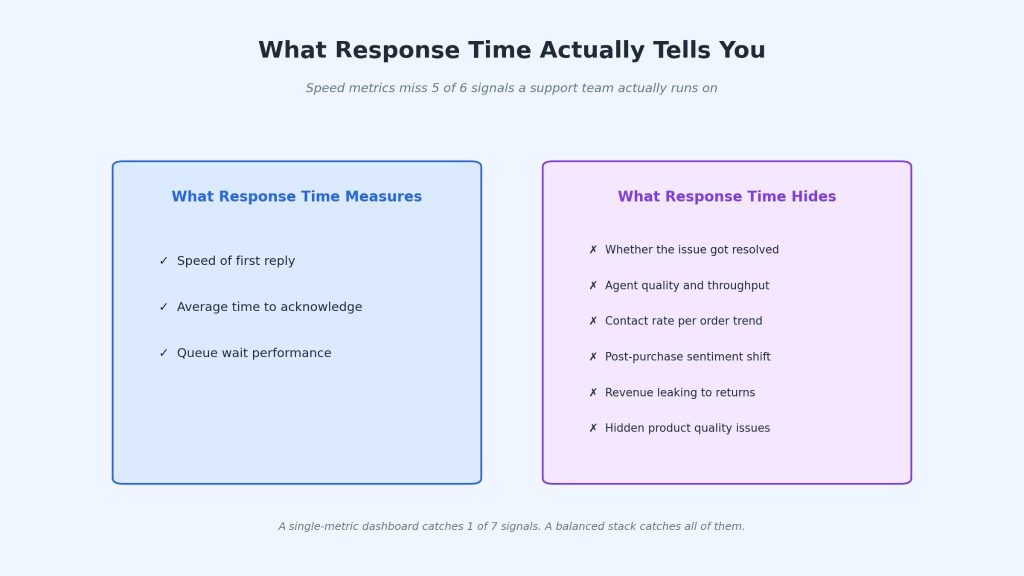
A dashboard that only tracks response time misses every one of those levers. Modern chat platforms can function as a direct support channel and a proactive chatbot for lead generation at the exact same time.
Here’s the shift every support manager should make. Move from speed metrics to outcome metrics. 60% of customers define “immediate” as 10 minutes or less, which sets the floor on speed expectations. The ceiling on team value gets built on what happens after the response lands.
The top 5% of ecom brands measure a 7-KPI stack that covers resolution, efficiency, cost, quality, and revenue impact. The bottom half track 1 or 2 metrics, call it a day, and then wonder why their support team keeps missing quarterly goals.
💡 Pro Tip
Pair every speed metric with a quality metric on the same dashboard row. Response time sits next to the resolution rate. Handle time sits next to CSAT. If speed improves while quality drops, the dashboard catches it within a week instead of a quarter.
Why Most Support Dashboards Track the Wrong Signals
Most support dashboards get built backward. They pull the easy data (response time, total tickets) and never get to the actionable data (resolution rate, contact rate per order, cost per ticket).
The industry-average first response time for ecom support sits at 4-6 hours, which sounds fixable. But first response time has a weak correlation with repurchase rate. 93% of buyers repurchase after a good support experience, and what earns that repurchase is whether the problem got fixed.
First-reply timing sits in the background.
The best ecom ops set a first response floor (under 4 hours) and stop optimizing past it. I’ve watched managers spend 3 quarters chasing a 30-minute response time while their FCR drifted from 72% down to 61%. The team got faster at saying hello. They got worse at solving anything.
The 7 KPIs below give you speed, quality, and revenue signals in one stack. Teams usually adopt this kind of layered view of their productivity metrics once basic ticketing tools run out of room.
The 7 Customer Support KPIs That Actually Predict Revenue and Retention
Every KPI below gets tracked at a SKU or issue-type level, not in aggregate. That’s the difference between a dashboard that tells you what happened and one that tells you what to fix.
1. First Contact Resolution Rate (FCR)
The percentage of tickets closed in 1 interaction. No follow-up, no callback, no escalation. The single most telling signal of support quality.
Your target: 75%+ if you’re healthy, 80%+ if you’re best-in-class. Ecom industry average sits at 68%.
Below 60%? Your knowledge base is the problem 8 times out of 10. Agents without fast, searchable answers cut corners on wording, skip steps, or guess, and all 3 cause repeat tickets. Fix the KB before you touch training. FCR usually climbs 5-8 points inside a month.
Between 60-75%? Break FCR down by issue type. A refund request might hit 95% while warranty claims sit at 45%. That gap tells you where the playbooks, tooling, or training is breaking. Fix the worst category first.
⚠️ Common Mistake
“Train harder” is the first move most managers reach for because it feels controllable. It’s also the slowest path to FCR improvement. A knowledge base audit ships results in 3 weeks. A training overhaul ships in 3 months.
2. Average Handle Time (AHT) by Product Category
Talk time + hold time + after-call work, divided by total interactions. The cross-industry ecom benchmark sits at 3 minutes 29 seconds.
Most AHT benchmarks miss a second variable: how much support work the product page absorbs before the ticket ever gets filed. A product page carrying its own fit guide, installation walkthrough, and install-help partner is doing real deflection. The tickets that still come through are the ones the page couldn’t answer, which tend to be the hardest ones.
Look at how the Brondell Swash 1400 page handles pre-sale. Exact bolt-hole measurements for round vs elongated. A downloadable installation guide. A TaskRabbit partner link for buyers who want a pro to install it. All of that shifts the easy questions off the support team before checkout.
What’s left is a buyer asking a rep to compare the 1400 against the LE99 on specific features, or walking through a non-standard bathroom layout. Those tickets land at 10-12 minutes each because the 2-minute tickets were handled by the page.
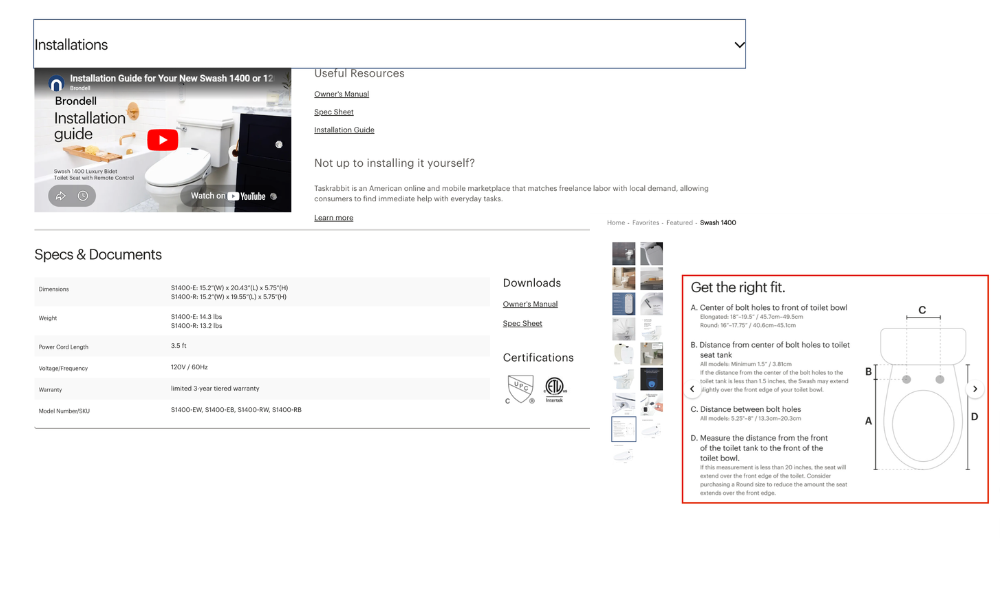
That’s why a flat AHT target punishes the wrong teams. A brand doing strong pre-sale deflection looks slow on paper. A brand doing no deflection looks fast but carries 3x the ticket volume at half the margin. Benchmark AHT against your own deflection rate, not against an industry average.
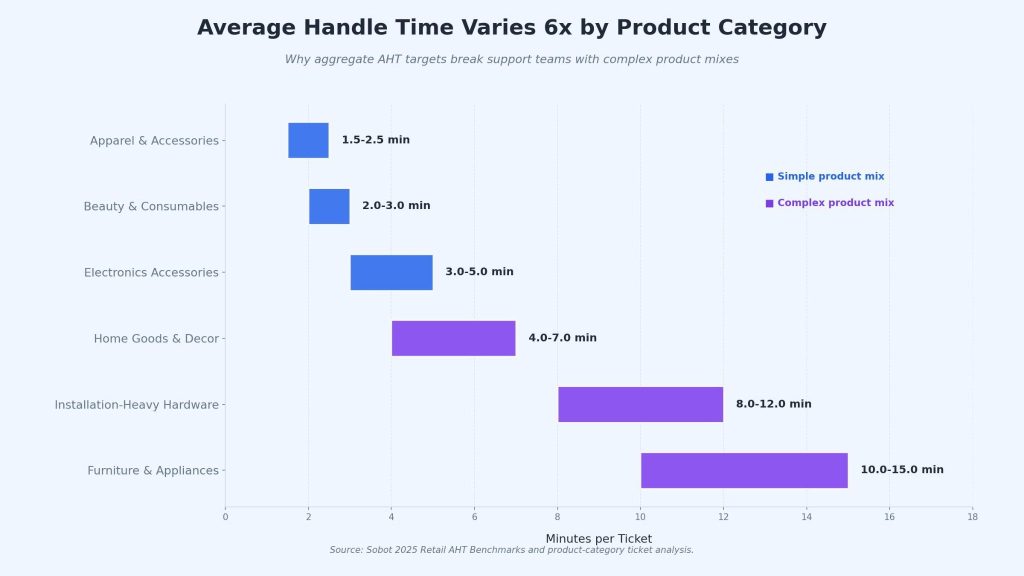
Your target by category:
- Apparel and beauty: 1.5-3 min
- Electronics accessories: 3-5 min
- Home goods: 4-7 min
- Installation-heavy or furniture: 8-15 min
AHT climbing with FCR climbing? Good news. Your team is handling harder tickets more completely. Leave it alone.
AHT climbing with FCR flat or dropping? Check tool access first, then agent onboarding, then whether one product SKU is eating queue time.
AHT dropping with FCR dropping? Red flag. Agents are rushing. Back off any handle-time pressure this week.
📊 By the Numbers
Ecom AHT ranges from 0.82 minutes to 46.6 minutes across brands, with a median of 6.25 minutes. The 30x spread is all the proof you need that aggregate targets punish the wrong teams.
3. Tickets Per Agent Per Shift
Total resolved tickets divided by agents on shift. Your capacity read.
Your target by channel:
- Chat or email: 30-50 tickets per 8-hour shift
- Phone: 35-55 tickets per 8-hour shift
- Mixed queue: 25-40 tickets per 8-hour shift
Below target? Check 3 things in this order: tool friction (switching between 4 tabs to answer 1 ticket), routing (agents getting issues they’re not trained on), and shift staffing (too many agents on a quiet block).
Above target with FCR dropping? Agents are closing tickets to hit volume instead of resolving them. That’s the burnout pattern that precedes your next 2 quits.
New agents ship 20-30% fewer tickets per shift for their first 4 months. Factor a 4-6 week ramp into every hiring cycle before you judge their numbers.
4. Contact Rate Per Order
Total tickets divided by total orders shipped, as a percentage. The earliest leading indicator of product or fulfillment issues you have.
Your target by category:
- Apparel, beauty, consumables: under 5%
- Electronics accessories: 5-10%
- Home goods and decor: 8-15%
- Installation-heavy hardware: 12-25%
- Furniture and appliances: 15-28%
Above your range? Product issue, onboarding gap, or a shipping problem. Read the top 20 ticket subjects from last week. The pattern shows up in the first 5.
Below your range in a complex category? Customers stopped bothering. They’re returning through Amazon or filing chargebacks. Check return rate and dispute rate alongside.
Spike of 15% week-over-week on a single SKU? Something changed in packaging, instructions, or the product itself. Get product and marketing on a call within 48 hours.
🎯 Pro Insight
Set an alert for any product line jumping 15% week-over-week in contact rate. It’s the cheapest defect-detection system in ecom, and it runs without a single engineering hour.
5. Resolution Time by Issue Type
Average resolution time as a single number tells you almost nothing. Segment it by issue type, and it becomes one of the most valuable signals on the dashboard.
Your target by issue type:
- Order status questions: under 2 hours
- Refund requests: under 4 hours
- Product questions: under 24 hours
- Warranty claims and defects: under 72 hours
- Installation support: under 48 hours
One category drifting? Investigate that category alone. Warranty claims creeping from 48 to 90 hours usually means your vendor return process broke, not your support team slowed down.
The number your CFO actually asks about is whether warranty claims are trending up, because that ties directly to product quality and refund exposure next quarter. Segment the data the way your executives would ask the question.
6. Agent Utilization & Idle Time
The percentage of paid hours an agent spends on productive work. Idle time is the inverse.
Your target: 70-85% utilization. Enough breathing room for agents to handle complex tickets well without burning out.
Below 65%? Usually 1 of 3 things. Ticket routing is broken (agents sitting idle while another queue overflows), tool switching is eating 15-20 minutes every hour, or you’re overstaffed for current volume.
Above 90%? You’re understaffed. FCR drops within 2 weeks, and attrition follows within a quarter.
Idle time caused by training is healthy. Idle time caused by tool confusion or bad queue design is where most teams find 15-25% of their hidden capacity. You can’t fix what you don’t measure.
7. Post-Purchase Contact Rate
Percentage of customers who reach out in the 30 days after delivery. The single best leading indicator of product satisfaction and repeat purchase likelihood.
Your target by category:
- Simple products (apparel, consumables): under 5%
- Home goods, wellness, tech accessories: 5-15%
- Complex or installation-heavy: 15-25%
Above your range? Instructions, fit, setup, or quality are breaking somewhere between delivery and day 30. Read the top 30 tickets from last week. The theme is usually obvious by ticket 10.
Near zero in a complex category? Customers gave up on support. Check return rate and chargeback rate.
The timing of the contact matters as much as the volume. A customer who contacts in week 1 is more likely to return the product. A customer who contacts in week 3 and gets a fast resolution is more likely to repurchase within 90 days. Same behavior, different timing, completely different revenue outcomes. Track contact rate by week-since-delivery, not just in aggregate.
How AHT Benchmarks Differ Between Simple and Complex Ecom Brands
Not every AHT benchmark fits every brand. The product type dictates what a healthy number looks like.
| Product Category | AHT Target | Contact Rate | Top Support Driver |
| Apparel & accessories | 1.5-2.5 min | 3-5% | Order status, sizing |
| Beauty & consumables | 2-3 min | 4-7% | Ingredient questions, reorders |
| Electronics accessories | 3-5 min | 7-10% | Compatibility, setup |
| Home goods & decor | 4-7 min | 8-12% | Fit, shipping, assembly |
| Installation-heavy hardware | 8-12 min | 15-25% | Pre-sale fit, install, warranty |
| Furniture & appliances | 10-15 min | 18-28% | Delivery, install, returns |
The jump from apparel to installation-heavy products isn’t incremental. It’s 4-6x on AHT and 3-5x on contact rate. A support team covering both categories in a single queue needs completely different playbooks, agent skill sets, and shift coverage.
The deeper insight most support ops miss: AHT trending up doesn’t automatically mean trouble. If AHT climbs while FCR climbs alongside, your agents are handling harder tickets more completely. That’s a quality improvement, not an efficiency problem. Pair every AHT conversation with FCR and CSAT before you make any staffing decision based on the number alone.
Most support tools will give you AHT in aggregate. Getting it by product category usually takes a manual tag on each ticket or a CRM integration. The setup cost is worth it. Aggregate AHT is one of the most commonly misinterpreted metrics in ecom, and segmenting it is what turns a noisy chart into an actual operational tool.
Your 30-Day Action Plan To Fix Your Support Dashboard
You don’t need a CRM migration to start tracking these 7 metrics. A focused 4-week sprint gets most teams 80% of the value with their existing tooling.
Week 1: Baseline Every Metric
Pull the last 30 days of support data. Calculate each of the 7 KPIs across the full team. Don’t worry about segmentation yet. You need a starting number for every metric before you can measure improvement.
Week 2: Segment by Product and Issue Type
Break AHT, FCR, and contact rate down by product category and issue type. Most teams discover 2 or 3 product lines driving an outsized share of ticket time. That’s where your playbook updates and agent training should start first.
Week 3: Identify the 1 Metric That’s Bleeding Revenue
Every ecom support team has one weak metric costing the business real money. Usually, it’s FCR (customers hate follow-up tickets), post-purchase contact rate (product issues going unnoticed), or contact rate per order (product launches breaking customer expectations). Pick one. Ignore the others until this one improves by 10%.
Week 4: Set a Weekly Review Cadence
Build a simple weekly dashboard. 7 KPIs, last-week versus 4-week average, 1 manager comment per metric. Review it in a 30-minute weekly ops meeting. No longer, no shorter. Dashboards that require a 2-hour meeting get skipped within a month.
Early wins you can expect in 30 days: 10-15% FCR improvement from better knowledge base content, 5-10% AHT reduction from tighter templates, and a much cleaner view of which product lines generate the most support burden.
The longer-term win is cultural. Your support team stops thinking of themselves as ticket closers and starts thinking of themselves as a revenue-protection function.
📌 Key Takeaway
A dashboard with 7 well-chosen KPIs reviewed weekly will outperform a dashboard with 30 KPIs reviewed monthly, every single time. Speed of review beats depth of data in ecom support. The fastest-moving teams catch issues within 7 days of a change and act on them before the next sprint.
5 Warning Signs Your Support KPIs Are Painting the Wrong Picture
Even good dashboards can lie. Here are 5 signals that your metrics aren’t telling you what you think they are.
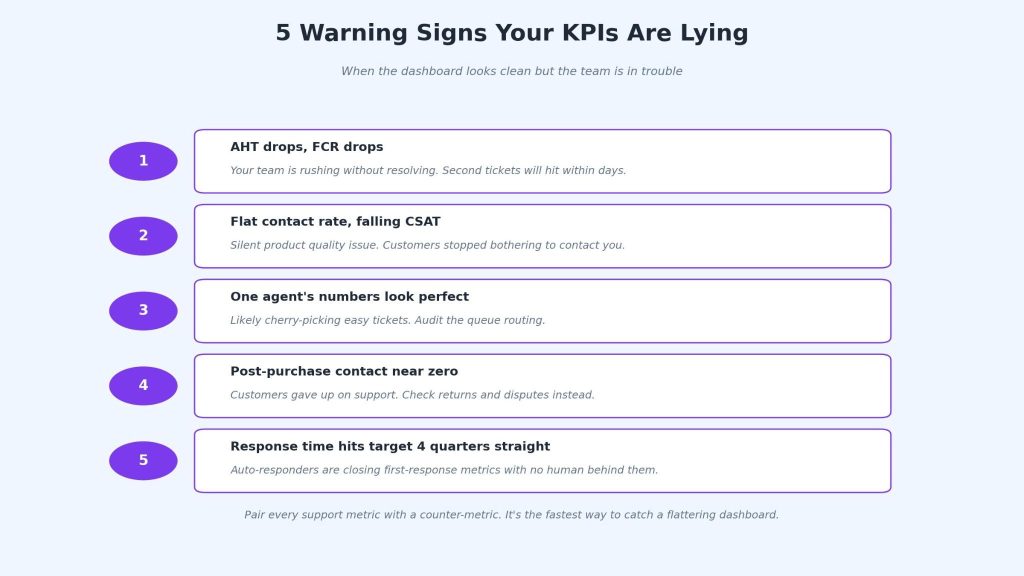
1. AHT is dropping, but FCR is also dropping. Your team is rushing through tickets without actually resolving them. Faster interactions that don’t fix problems get followed by second tickets, which bloat total volume and erode CSAT. If AHT drops 15% but FCR slips even 3 points, back off the handle-time pressure immediately.
2. Contact rate per order is flat, but CSAT is falling. Same ticket volume, worse sentiment. Usually, it means a silent quality issue in a product line where customers are starting to resent the experience, but have stopped bothering to contact you. Check review sites and social mentions to find the gap.
3. One agent’s numbers look perfect. Agents who never miss AHT targets and always hit FCR goals are often cherry-picking the easy tickets from the shared queue. Audit their ticket assignment mix. Healthy teams show natural variance across agents, and the “perfect” agent is usually a routing problem disguised as a performance win.
4. Post-purchase contact rate is near zero. Either your customers love everything (rare) or they’ve given up on your support channel and are resolving issues through Amazon, chargebacks, or angry social posts. Check return rate and dispute rate alongside. Near-zero contact with rising returns is the worst combination in ecom.
5. Response time hit the target 4 quarters in a row. Sounds good. Usually, it means auto-responders are closing the loop on first-response metrics without any human actually responding. Check your bot containment rate. If 60%+ of tickets are “resolved” by auto-reply, you’ve got a measurement problem, not a performance win.
Pair every support metric with at least one counter-metric. It’s the fastest way to catch when your dashboard is flattering you instead of telling you the truth.
Better Metrics Turn Support Into a Revenue Driver
Support teams that track these 7 KPIs spend less time defending their workload and more time shaping the roadmap. Start this week with a baseline pull of your current numbers, then add 1 new KPI to your dashboard each week for the next 7 weeks.
The fastest compounding returns come from teams that treat support data the same way marketing treats performance insights: as a leading indicator of everything happening across the business.